
Hi Rayner, so I know we use the Currency Strength Meter as a guide for our weekly trades, and we pair them accordingly. But in your weekly market analysis, you also trade other setups like USD/IND or USD/ZAR etc. How do you come across those setups and why do you trade them?
Yes, you are right, I trade exotic pairs like those you’ve mentioned. Those are not in the Currency Strength Meter. I could have added more currencies to the Currency Strength Meter, but I just stick to the major pairs.
How I find these other pairs is that, as I do my analysis and homework, I also look for potential setups that I can trade for trend continuation trades, breakout trades and stuff like that.
The Currency Strength Meter just serve as a guideline as to what’s strong and what’s weak. But some certain markets or pairs are not in the Currency Strength Meter which I trade as well.
I need more clarification on advance breakout strategy, where you do the multiple time frame analysis. I have a confusion, you earlier discuss a buildup at support as a chance of market breaking down lower, but you are suggesting to go long with higher timeframe support. I am a little confused.
I assume this question is referring to entering the breakout before the breakout. I usually combine the 4-hour and daily timeframe or the daily and weekly timeframe for this.
On the daily timeframe, let’s say you are looking for a buildup to form at resistance. On the 4-hour timeframe, it will look like a range. And within this range, you can look for a false break at support to go long.
Going through the course I have been interested in swing trading approach, can you share with us more on that topic?
For swing traders, they usually have a pre-determined exit in mind to exit their trades. As a swing trader, you want to be certain that the price has a good chance of reaching that potential target that you’re looking at.
From there, you can backtrack and see how much you’re potentially risking, and so how much you can potentially gain if you’re right, then you can assess your risk-to-reward on the trade.
You can check out this training video on swing trading in the Ultimate Price Action Trader course.
How to predict trend accelerations and decelerations?
To be honest, I don’t really look at trend acceleration or deceleration.
But if you want my take on it, when the trend is accelerating, it’s when the price is showing huge momentum with large-bodied candles. When the price is decelerating, this is when the price goes into consolidation or a range, where the trending move is not as strong as before.
I can’t predict trend acceleration and deceleration. I can only trade what I see and not what I think. And the key thing to understanding market structure is to see how the price reacts at key levels like support resistance.
For instance, if the price comes to a support level on the daily timeframe, you can go down to a lower timeframe like the 4-hour and see how the price reacts on the 4-hour timeframe.
The trend could be decelerating but it might just be a small pullback before it stages another move higher. So I would rather understand the 4 stages of the market, advancing, accumulation, distribution or declining.
Then from there, I’ll trade what I see. I won’t try and predict when the trend is accelerating or decelerating because I just can’t do that.
If a strong trend weakens and becomes a healthy trend with deeper pullbacks, is it better to save profits after the next main move or to trail the healthy trend till the break of previous highs/lows? And opposite, if the trend becomes stronger is it better to trail till the end of the new stronger trend, or to keep trailing after it becomes a weak trend?
Every time you put on a trade, you must know what’s your plan of exit, are you going to trail your stop loss or are you going to capture a swing.
You cannot make plans according to how the market behaves. Because if the market doesn’t behave according to what you want, then what will you do?
If you want to capture a trend, then use a trailing stop loss from the start. If you want to capture a swing, then have a pre-determined target profit ahead of time. Don’t change your mind halfway through the trade.
Because if you do this, you will realise you will give way to your emotions and make the worst trading decisions by reacting to the market.
When you put on a trade, you won’t know if it’s going to be a full-blown trend or will it go in your favour only to reverse against you. You have no idea.
That’s why you’ve got to determine ahead of time how you exit your trade if it moves in your favour and if it moves against you.
The only way to find the perfect answer is to trade on hindsight. But we are not trading on hindsight, we are trading in the current moment. That’s why you have to determine your exits way ahead of time and not adjust them accordingly.
If my higher timeframe is 30-minute and lower is 1-minute, when placing the stop loss, what ATR should I use, 1-minute or 30-minute ATR?
If your higher timeframe is the 30-minute timeframe, I recommend your entry timeframe to be the 5-minute timeframe. Because the 1-minute timeframe is too far away from the 30-minute. Ideally, you want to have a factor of 4 to 6.
You should use the ATR of your entry timeframe. If your entry timeframe is the 5-minute, you should look at the 5-minute’s ATR value. It makes things easier to reference from the ATR value of the entry timeframe of yours.
The first thing that you see is long-term downtrend and then big retracement move comes, so you try to find a break of structure on the lower timeframe to go short. In this case, would you record your trade as trend continuation or breakout?
I would classify this as a trend continuation trade because the big picture on the higher timeframe is in a downtrend.
However, if the price is accumulating after a downtrend, and it starts to buildup and then breakout at the resistance of this accumulation stage, I would consider this as a breakout trade.
What are the pros and cons between trailing stop by 3 ATR and ride momentum candle on higher timeframe?
I would say the 3 ATR method is simper, you can adjust the multiple according to the type of trend that you want to capture.
You can simply use the Chandelier Kroll Stop, if the price breaks and closes below that, then you exit the trade. You can use 4 ATR or 5 ATR if you want to capture a longer-term trend.
For momentum candle on the higher timeframe, you have to go up to the higher timeframe and trail your stop loss from there. But this method is quite fixed.
The easiest way to capture a trend is to just use a Chandelier Kroll Stop, 3, 4 or 5 ATR depending on the trend you want to capture.
If you want to capture a swing, you can use the higher timeframe candle. When the price breaks and closes below the previous candle on the higher timeframe, you can exit the trade.
Hello Rayner, I have completed the lessons which gave me lots of information I didn't have earlier. Let me try to apply the methods. Rayner, I'm not good at computer, so, it would be a hurdle for me how to make a Trading Journal. Please help me.
In the Ultimate Price Action Trader, I’ve covered quite extensively how to build your own trading journal, with things like recording your entries, exits, R-multiples, screenshot of your chart.
You can find that here.
If Fed is buying stocks and bonds, then isn't shorting or put option trading now useless on sorry companies?
The Fed doesn’t buy stocks, they print money which goes into the stock markets.
I don’t trade options, so I can’t comment on that.
For shorting, a lot of exchanges have regulations with regards to shorting. It’s trickier for shorting because sometimes there might not be enough shares to borrow. Sometimes the exchange doesn’t allow you to short. I don’t short stocks as well.
For going long, you can do it as and when you want it.
I think I’m not in the position to comment on this since I don’t really short the markets and I don’t trade options.
Is it possible to use the same concept to prepare the Currency Strength Meter on different types of markets like metals, commodity, energy, index and crypto? How about mixed market strength meter?
Yes, it’s possible, you can use the concept behind the Currency Strength Meter on these other types of markets.
The key thing is, they have to be from the same type of financial instrument. It doesn’t make sense to put oil futures and EUR/USD in the same strength meter.
I trail my positions by moving my stop loss 1 ATR below the swing low for long positions and 1 ATR above the swing high for short positions, and always exit before earnings. In general, I found this to be profitable, however, it gives a lot of profits back. I understand that I cannot avoid giving up some profits with this type of trade management, however, is there anything I can do to reduce the profits I give back?
Let’s say you’re up by 2R, what you can do is to exit half your position to secure those profits. Then you can have the remaining half the position to ride the trend if it continues.
If it goes against you, then the good thing is that you’ve already exited half of the trade at a favourable price, which gives you a better overall average price in total.
This is how you can partially scale out of your trade.
I noticed that the biggest drawdown in my equity curve is due to a market turn. How do I know when the market is about to turn so I can get out early and not open new positions? I find that waiting for the moving average crossover on the SPY is 'late' and gives almost profits back. Thanks Rayner.
I wished I can tell you when the market is going to turn, but I don’t know when the market is going to turn. This is why I choose to keep things really simple.
I have a few stock trading systems. The way I move into cash is by using a trend filter. It’s as simple as using a 200-day moving average. If that stock is below the 200-day moving average, I don’t buy anymore, I take it that the stock is in a downtrend and I am not looking to buy anymore.
You can use a 100-week moving average, you can use a 10-month moving average. Whatever trend filter you want to use, it can work. I have used the 200-day, 100-week, 10-month average. It all depends on the timeframe you’re trading.
For starters, if you’re trading on the daily timeframe, then the 200-day moving average is a good trend filter to use.
For example, if the S&P 500 is above the 200-day moving average, you’ll look for buying opportunities. If the S&P 500 is below the 200-day moving average, you’ll exit all positions you have and look to get back in if it closes above the 200-day moving average.
I’ve come across research which shows that when the market is above the 200-day moving average, it tends to continue going up than going down; when the market is below the 200-day moving average, it tends to continue going down than going up.
When I trade trend continuation (resistance turned support). Do I need to wait for just price rejection (only one candle) or wait for entire false break setup (like a clean move into the level)?
Yes, I look at the overall context of the market, and if that price level is a significant level.
I like to see a strong momentum move into a level because when the reversal comes, it can be pretty swift in the opposite direction.
Then I look at the type of price rejection to see how strong the price rejection is. If it’s not very strong, I’ll go to the lower timeframe and look for a break of structure, like a higher high and higher low, to time my entry.
So I look at the whole picture, not just one part of the equation.
How to create my Currency Strength Meter spreadsheet? I am using Trading View platform for my analysis.
If you want to learn more on that, you can check out my blog post here.
I've been reading that we should trade forex based on the New York session where daily candlesticks open and close at 5 am Singapore time. However, my two Singapore brokers have their daily candlesticks closing at 12 am. Does it make a difference at all?
Visually, it will make a difference. One market that closes at 5 am may look like a shooting star, while the other that closes at 12am may look like a different candlestick pattern altogether.
But in terms of drawing support resistance, trendlines, it will not make much of a difference.
Honestly, after seeing different variations of the candlestick patterns, to me, it doesn’t really matter if it closes at 5 am or 12 am.
But for starters, yes it might make a difference for you. If you want to be in sync with most other traders, you can use a platform like Trading View. I think they allow you to adjust which time zone to look at as well.
What's your view on Gold price, possible to wait for a pullback?
Gold seems pretty overextended at this point in time if you asked me:
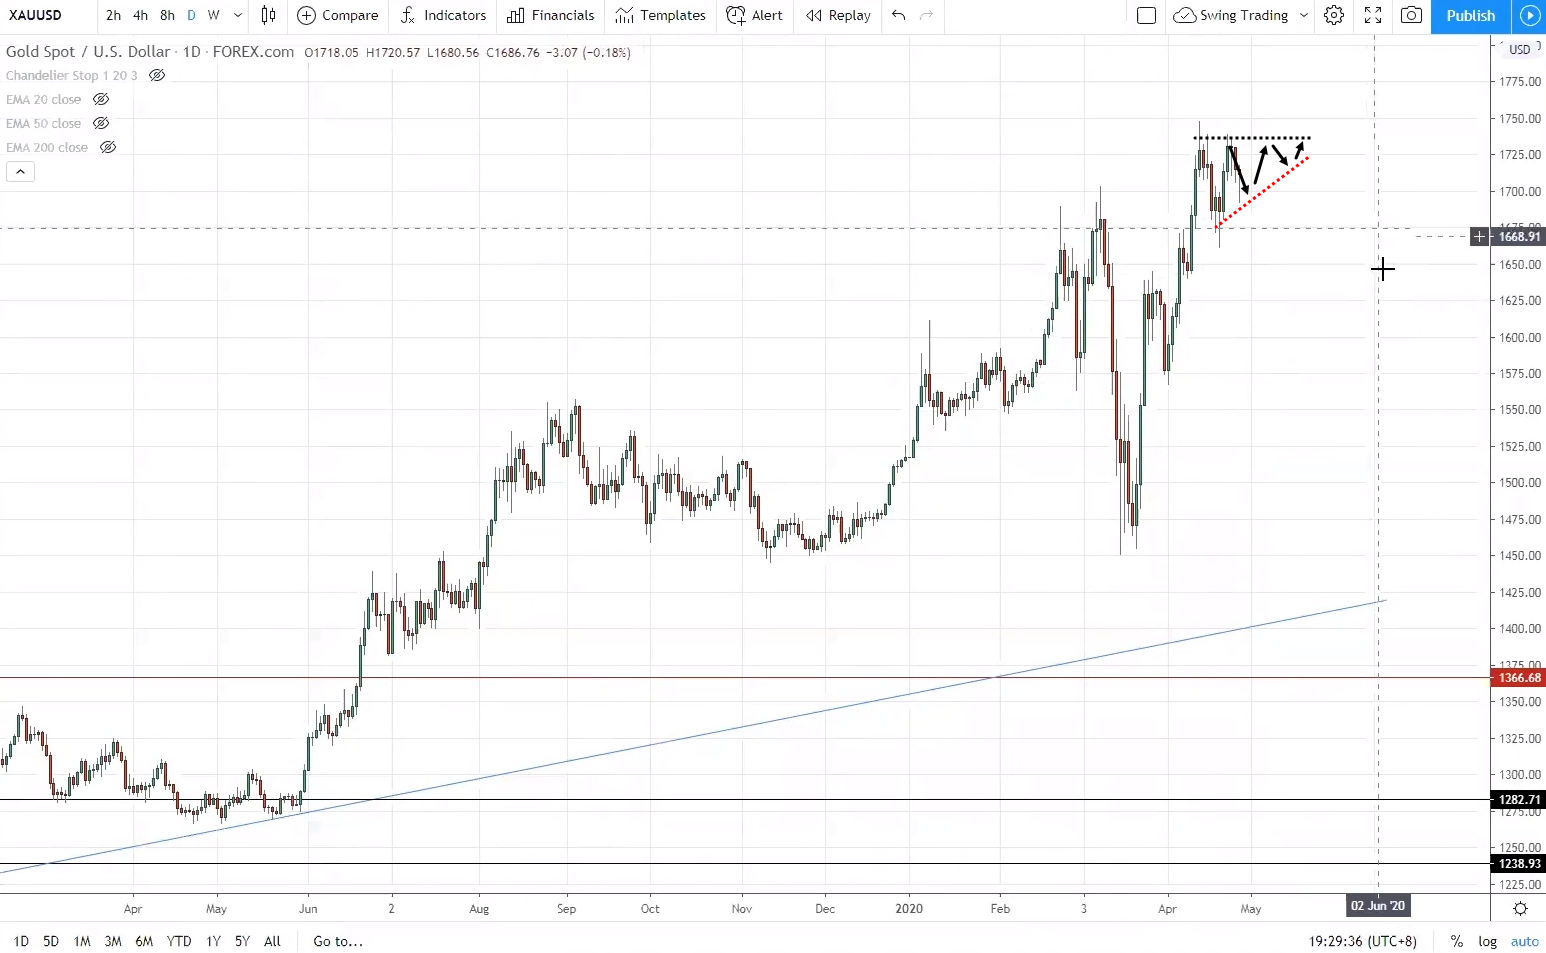
I’ll probably look for a pullback before looking for an entry. I don’t really want to be buying at these highs.
Because if you look at the price action of gold historically, it usually goes up and then retraces. So there’s a good chance there could be a pullback.
This is a trend which I consider a weak uptrend, and I’ll just wait for a retracement or pullback before looking for long entries.
When do you use the different MA lines? Is it dependent on the kind of trader that you are? For instance, a shorter-term trader would use a 20/50 MA and a vice versa for a longer-term trader.
It depends on the trend structure. If the market is exhibiting a strong trend, then I’ll use the 20 MA to identify an area of value on a strong trending market.
If the market is in a healthy trend, then I’ll pull out the 50 MA to see where’s the area of value.
So it’s not dependent on whether I’m a long-term or short-term trader, but rather, it depends on the trend structure I’m seeing in the market. If the market is in a range, then I won’t even have any moving average at all because it’s useless in the range market.
Can we use systematic trend following using 4-hour or 1-hour candlesticks with the same indicator settings as the daily candlestick and if so, what they will be?
I have not tested the indicators on the 4-hour and 1-hour timeframe, I have no idea how the results will be like. But gathering what I heard from other veteran traders is that, it won’t work as well compared to the higher timeframe because of the choppiness and noise.
Sticking to the higher timeframe and longer-term trend is a better way to trade.
Again, I’ve not done any testing on it since I don’t trade systematically on the lower timeframe, that’s why I didn’t purchase data for it. So I didn’t do any testing for it.
Hi Rayner, I'm trading STF and MMT (from the Ultimate Systems Trading course) too. May I know how I should portion out my capital if I want to include discretionary trading?
There’s no fixed right answer to this because it depends on what you resonate with.
Do you feel more comfortable with systematic trading than discretionary trading? If that’s the case, you can apportion 70% to systems trading, then the remaining to discretionary trading.
But if you feel the other way, then apportion a higher percentage to discretionary trading instead.
So it depends on your personal preference ultimately.
How often do you adjust your support resistance line to account for the newer prices?
I adjust it at least once a week. I want to see if the level is still holding or if it got invalidated recently. If it got invalidated recently and if I look back in time and see that it got invalidated before, then I’ll remove that level altogether.
The key thing I look for is this, does the market still respect the level that I draw on my chart? If it’s whipping up and down that level, then that level is insignificant, and I’ll remove it from my chart.
Hi Rayner, would you advise that I use tools to determine profit-taking? Fibonacci tools, for example, to determine how far a pullback may go?
For those of you who have followed me long enough, you’ll realise I don’t really use Fibonacci for my own trading.
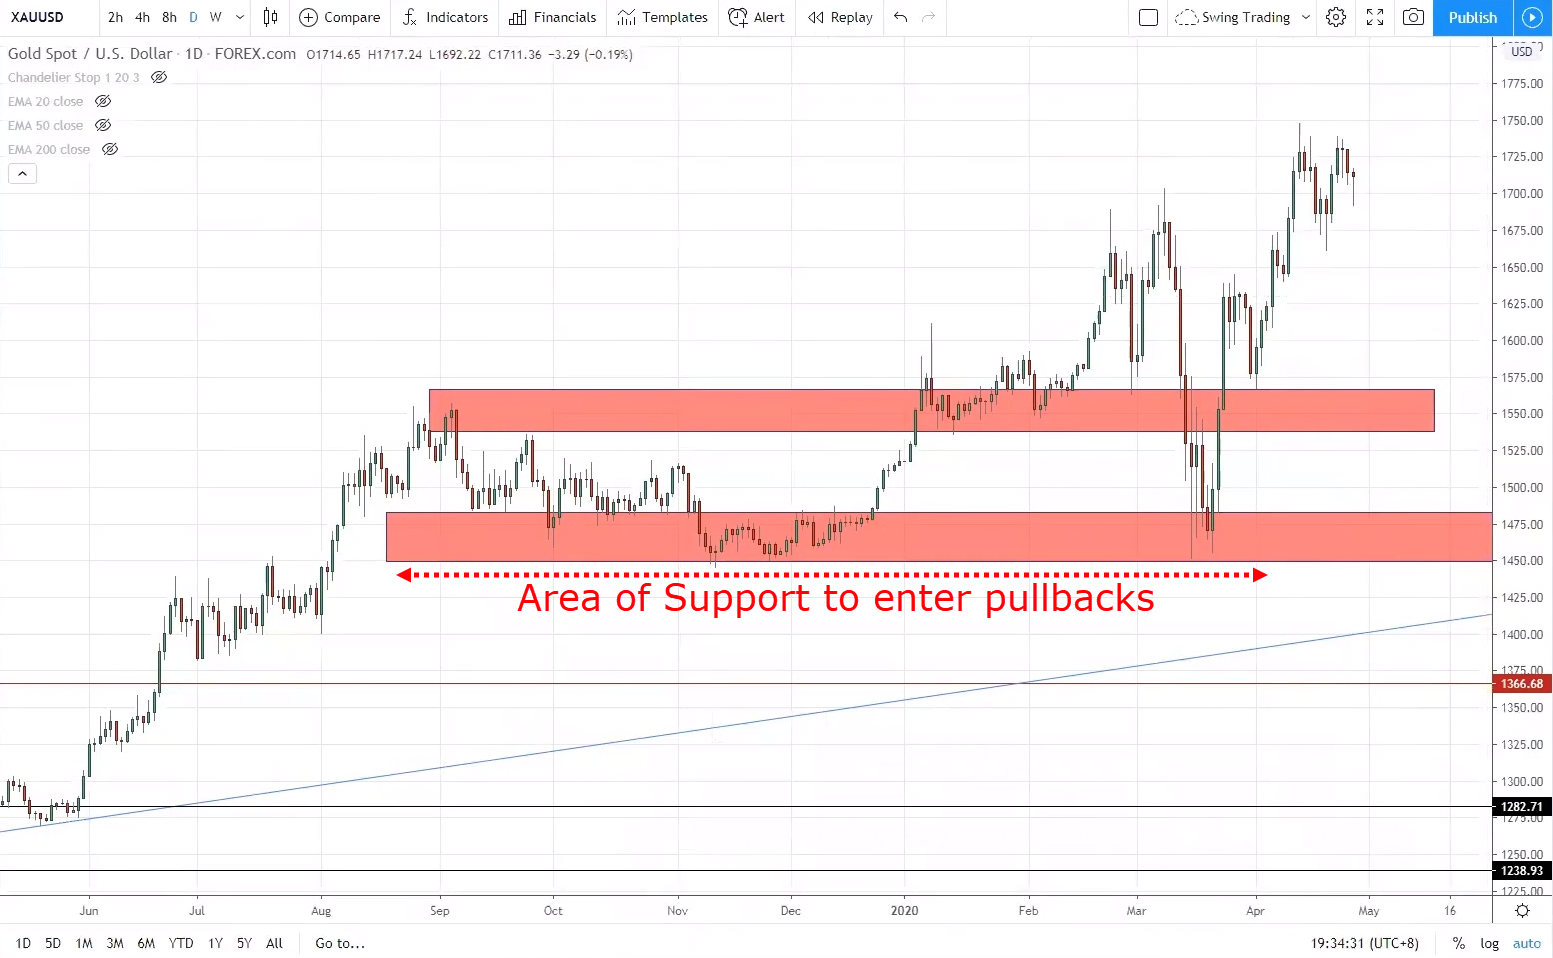
If you want to determine how far a pullback might go, I suggest to understand trend structure, if the market is in a strong, healthy or weak trend.
Once you can identify the type of trend structure this market is in, then you’ll have a good idea of where the price might pullback into to time your trade.
For the above example on Gold, since it’s in a weak uptrend, these are a few possible areas I’m looking at, to buy at the pullback:
Do you think it is okay to compliment Elliot Wave with price action to especially determine profit levels?
Profit levels are actually one of the easiest things to do, you don’t need Elliot Wave to confuse yourself. Just look and ask yourself, where might opposing pressure come in. That’s where you can take profit.
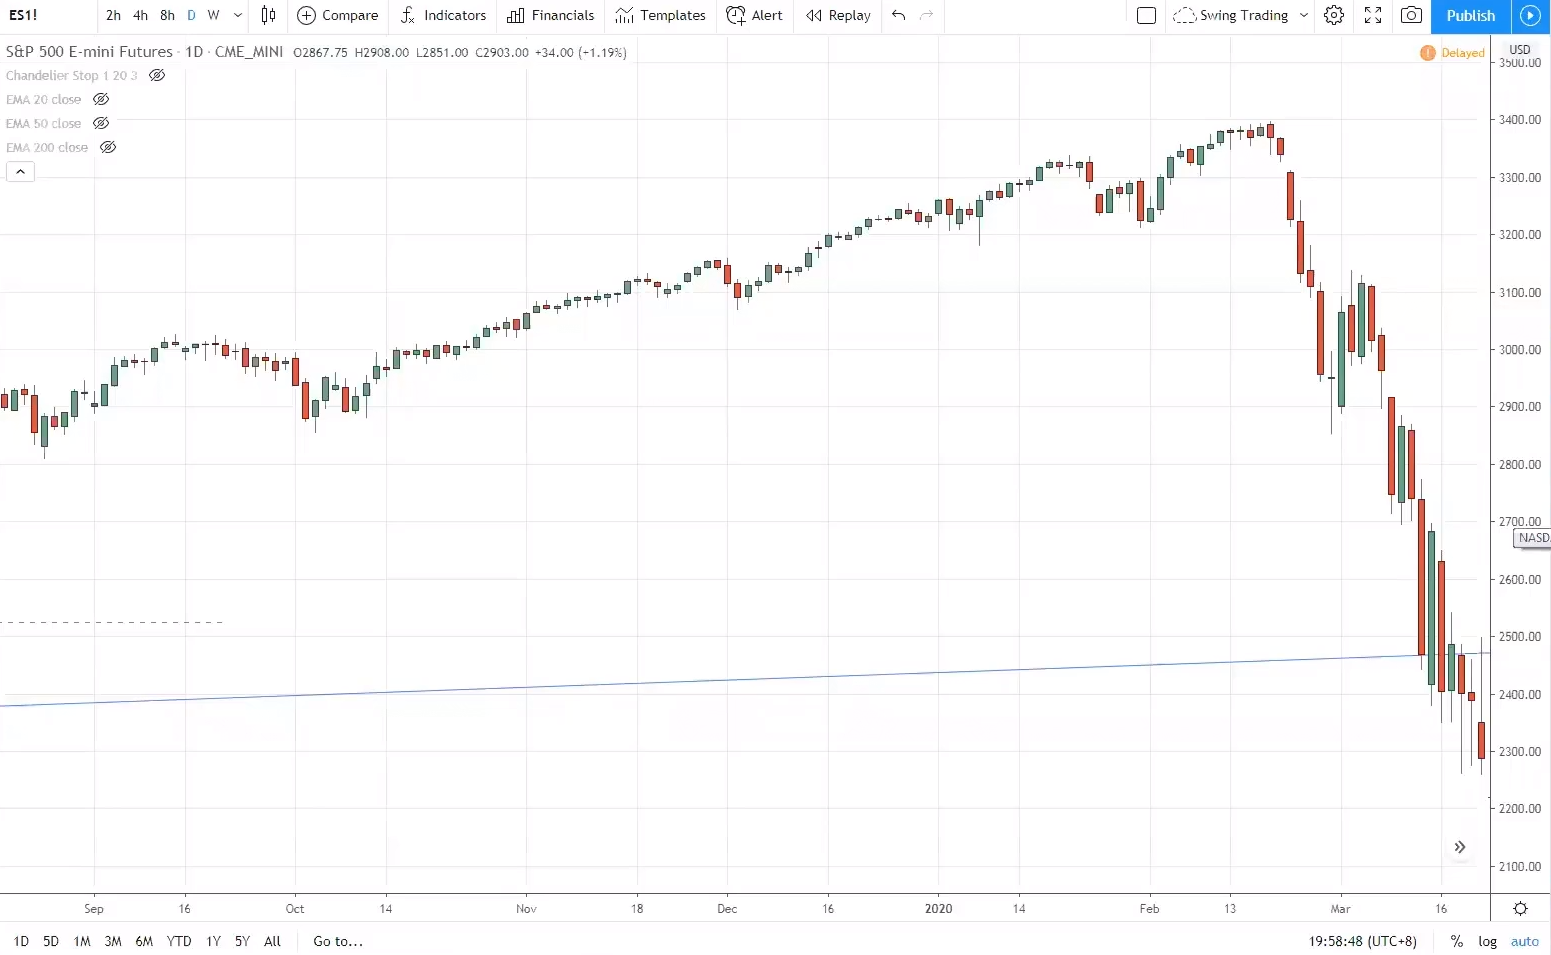
Looking at the S&P 500:
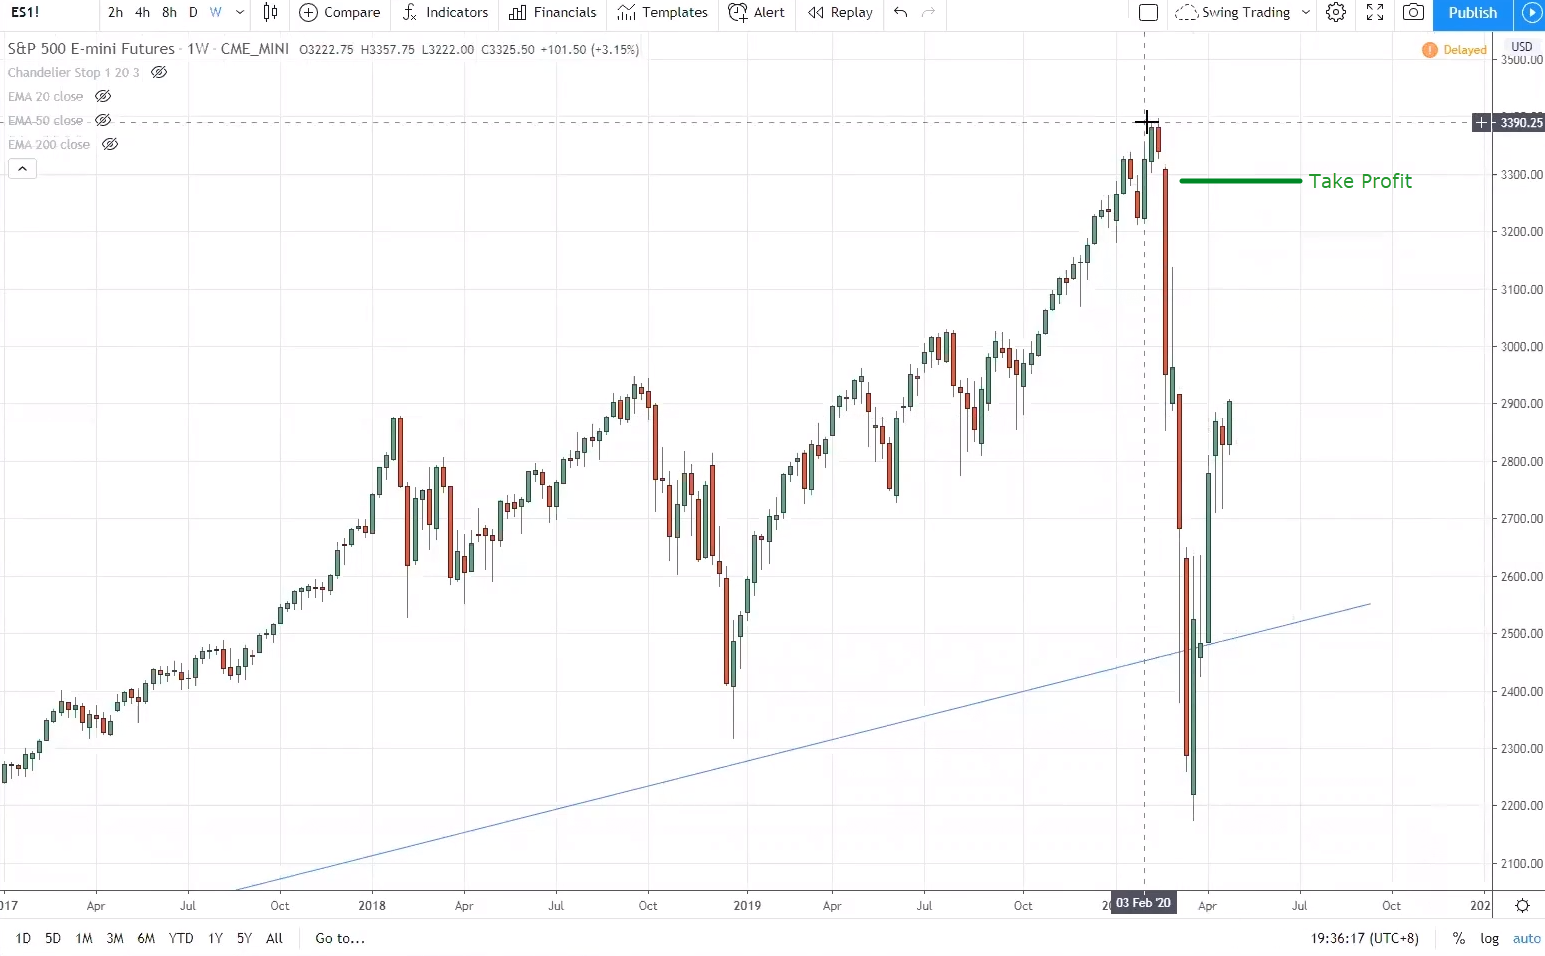
If I’m long right now, I’ll definitely look to take profit near the highs before it crashed. It’s a good level to take profit before potential selling pressure comes in.
So you don’t need Elliot Wave to determine where to take profit. You just need swing highs or swing lows, and support resistance.
The MT4 currency strength meter only shows 8 currencies (CHF, JPY, CAD, USD, EUR, NZD, AUD, GBP). Is it possible to customise the meter to change the currency pairs and also change the USD as base currency?
The answer is no to both.
I do not understand the concept of Fibonacci number what I found is everything in this world was created by Fibonacci number so It's just a level that a lot of traders take action that is why you can fix target profit near it. Could you please explain in detail why 127, 161.8 are so significant? Thanks a lot.
I personally don’t use Fibonacci much in my trading and so I think Google will be your best friend to find out how Fibonacci numbers are derived to find out why it’s significant.
How do you trade range using price action?
The straightforward way is to trade the false break. What I like to do is to let the price reach above the highs of resistance, and then reverse lower which forms a false break setup for me to go short.
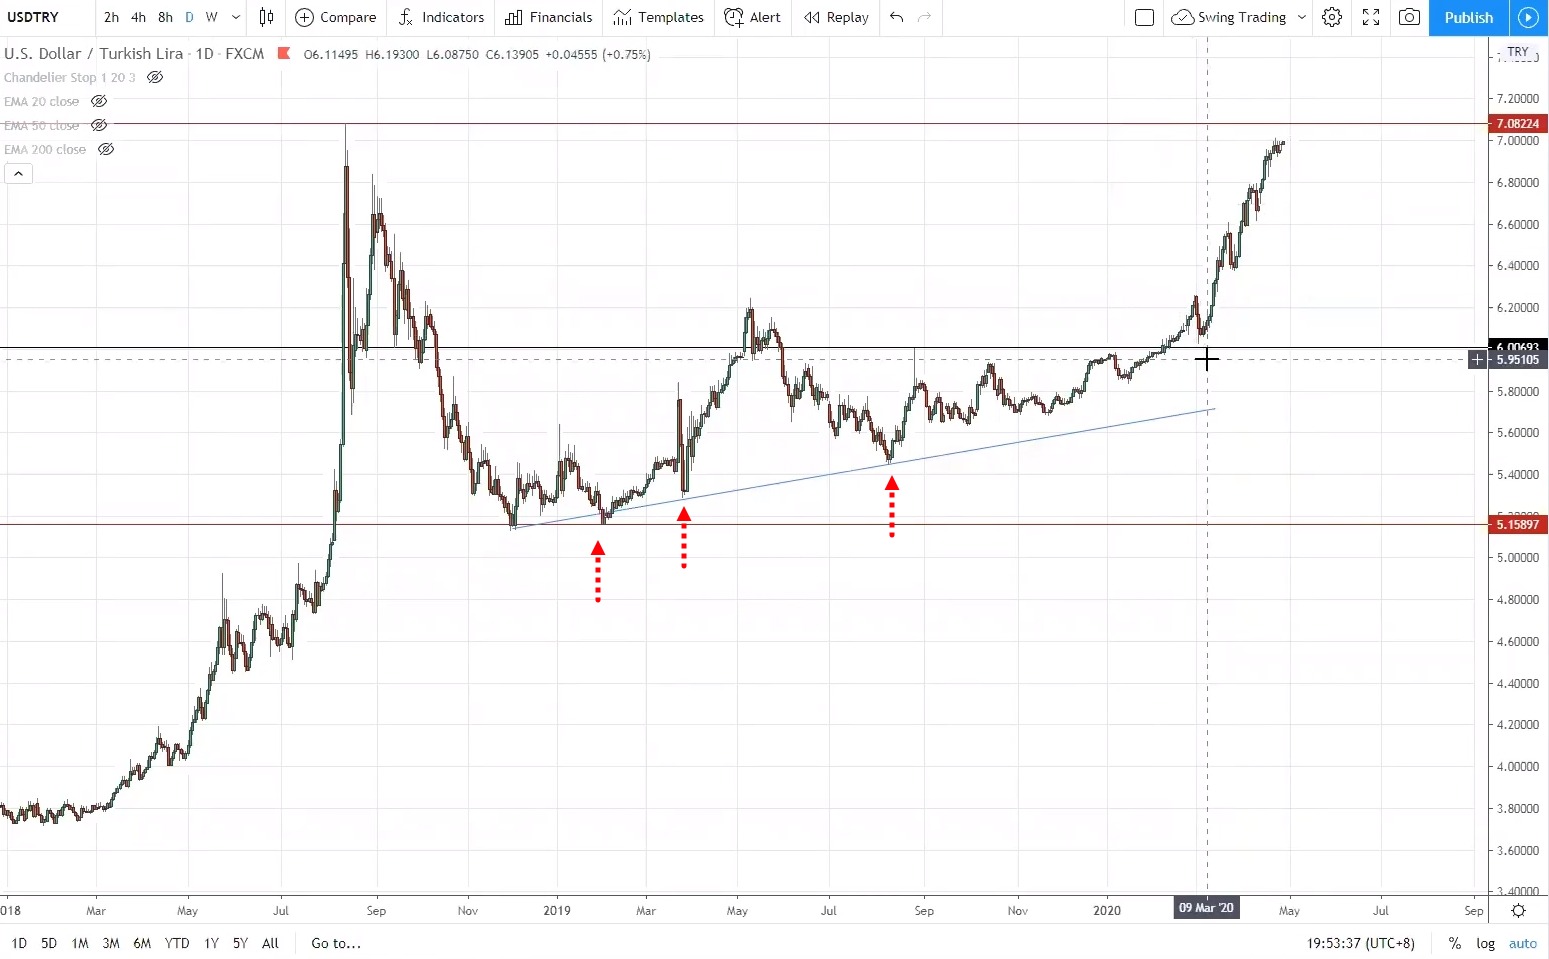
Why is the price fluctuation for currencies like USD/ZAR and USD/TRY greater than other major currencies (USD, EUR, GBP)?
It’s because those markets have less liquidity, and it’s easier to push the price of those markets up and down.
They have less liquidity than the major currencies because most people do businesses in the developed economies, so there’s a greater demand for major currencies in these developed countries.
Whereas the exotic pairs do not have as many businesses demanding those currencies, that’s why liquidity is lower and it makes the currencies fluctuate more.
Please also explain why the spread is larger for the exotic currencies. Is it to scare speculators away from trading these currencies? I have tested and found that the earning potential is huge if the price moves in my favour.
The spread is larger because of lower liquidity. It’s definitely not to scare speculators away. If you look at the order flows of the exotic pairs, you can see that there are less bid and offers, that’s why the spreads are wider.
Whereas for the major currencies, the order flow is thicker, with lots of bids and offers. This means there is higher liquidity and so, the spread is much tighter.
Hey Rayner, your UPAT material is excellent. I studied in a private channel that for trading, we have to follow any one of two sets of time frames, as follows: (5-minute, 30-minute, 4-hour, 1-week) and (1-minute, 1-hour, daily, monthly) i.e., usually, I use to follow the 4-hour timeframe, to know the reversal I have to verify 30-minutes and not the 1-hour chart. Please, let me know your explanation regarding this.
I’m not sure what you refer to those as two sets of timeframes. I hope not, if not you’re looking at like 8 to 10 timeframes.
Let’s say keep it simple. Ask yourself, what’s your entry timeframe?
If you’re entering your trade on the 4-hour timeframe, then your higher timeframe can be the daily timeframe, using a factor of 4 to 6. If you take 4 hours multiply by 6, you get 24 hours, which equals to 1 day.
If your entry timeframe is the 1-hour timeframe, your higher timeframe can be the 4-hour timeframe. That’s how I would define my entry and higher timeframe. I don’t look at 10 different timeframes.
What are the differences between trading equities and forex that I should take into account from a UPAT perspective? For example, forex is a 24/7 market so there are no gaps like you find in equities. Are there any other differences like this to keep in mind?
When it comes to candlestick patterns, the forex markets will not have gaps in the candlestick patterns.
For the bullish engulfing pattern, traditionally, the second candle has to gap lower and close higher than the previous day candle.
For the forex markets, you won’t see the gaps at all. Whatever candlestick patterns that require gap, it won’t happen in the forex market. You can just remove the gap element to redefine the candlestick pattern for the forex market. That’s the key difference to bear in mind.
For equities, they are usually traded only 7 to 8 hours a day, so it’s important to know the opening and closing hours of your trading session.
For forex, there are 3 different sessions, the Asian, the US and the UK session. And the most volatile session is the London session and the New York session overlap.
For equities, the most volatile is usually the first hour and the last hour of the trading day.
How can one apply the Law of Large Numbers to UPAT based trading? Because it requires a very systematic or uniform approach for it to be valid but UPAT style trading can be highly discretionary in terms of the patterns, setups, based on what one "sees".
You want to first define the setup you want to trade. Let’s say you want to trade the false break setup. Then you need a sample size of about 100 trades just for false break setup. Likewise for the other setups like breakouts, etc.
You don’t want to have 10 false break trades, 10 breakout trades, and alternate until you add up to 100, because those are different setups and patterns.
When you trade a trading setup, you want to have a large sample size of it before you analyse it and see whether you have an edge in the markets and whether it works or not.
This question has to do with the business of trading. I sometimes track up to 30 different markets (but might only have 8-10 positions open at one time) and I find taking technical analysis notes, entry/exit strategies and risk/money management calculations, equity tracking across 20 to 30 stocks can get overwhelming. I like keeping good notes because I can come back later and review my thinking and learn from mistakes. Let's just call all of this "trade admin". How do you manage the burden of trade admin? For example, how many issues do you track / trade on a daily or weekly basis? Do you keep daily notes? Weekly notes? I'm asking this question from the perspective of a medium swing trader who uses daily and weekly charts. Thanks.
This goes back to the trading journal module we spoke about in the Ultimate Price Action Trader module. The key things to record are your:
- Entries
- Exits
- Stop loss
- R-multiple
- Winning or losing trade
- Type of trading setup
I like to first have a higher timeframe chart. Let’s say you are a swing trader entering on the daily timeframe, you’ll want to screen capture the weekly chart of the stock you’re trading just to see where you are in the big picture.
The second chart that you’ll want to save is the daily timeframe which you used to enter the trade. You’ll want to mark out the entry point and the setup of the trade.
The last chart to screenshot is the exit of that trade. I like to screenshot a chart to see if it’s a winner or a loser.
Once you’ve collected a sample size of chart screenshot, you can see if there are familiar patterns that lead to your winners or losers. From there, you can tweak and improve things.
What is your view of the stock market in the near future? Do you expect a rally or a reversal coming soon?
These types of questions are kind of difficult for me because I try not to have a strong bias in the markets, and to just trade what I see.
From the looks of things, the S&P 500 has staged a strong rally from its lows and I’ll go with the path of least resistance.
If you asked me, I would say that I expect to see strength in the equities market over the next few days and weeks. I’m simply trading what I see.
I don’t know if there will be a reversal or it will be a breakout of the all-time highs. I’m just telling you what I see and I’m just going along with it. That’s how my trading has been like.
For price action trading strategies, what do you recommend to trade? Stocks, commodities, or forex?
There are really no best strategies. If you have been trading stocks all along, you can apply price action trading techniques to it.
You can buy breakout stocks that are near their 2-year high. You can look for trend continuation patterns like ascending triangle pattern to buy the breakout. You can apply price action technique as long as they have sufficient liquidity.
Price action trading can be applied to stocks, forex, or commodities.
How can I manage my time and trade if I work a 9 to 5 job?
I recommend you trade on the 4-hour, daily or even the weekly timeframe. Because when you trade on the higher timeframes, you don’t have to monitor the charts as often.
Let’s say you trade on the daily timeframe, then before you leave for work each day, you can look at the markets to see if there are any valid trading set up that occurred after the markets have closed. If there are, then put in your orders. It shouldn’t take you too long.
During lunch, you can check if your orders got filled. Then when you come back from work, you can see how that position is like.
What would you look for in a pullback to make it a higher probability trade?
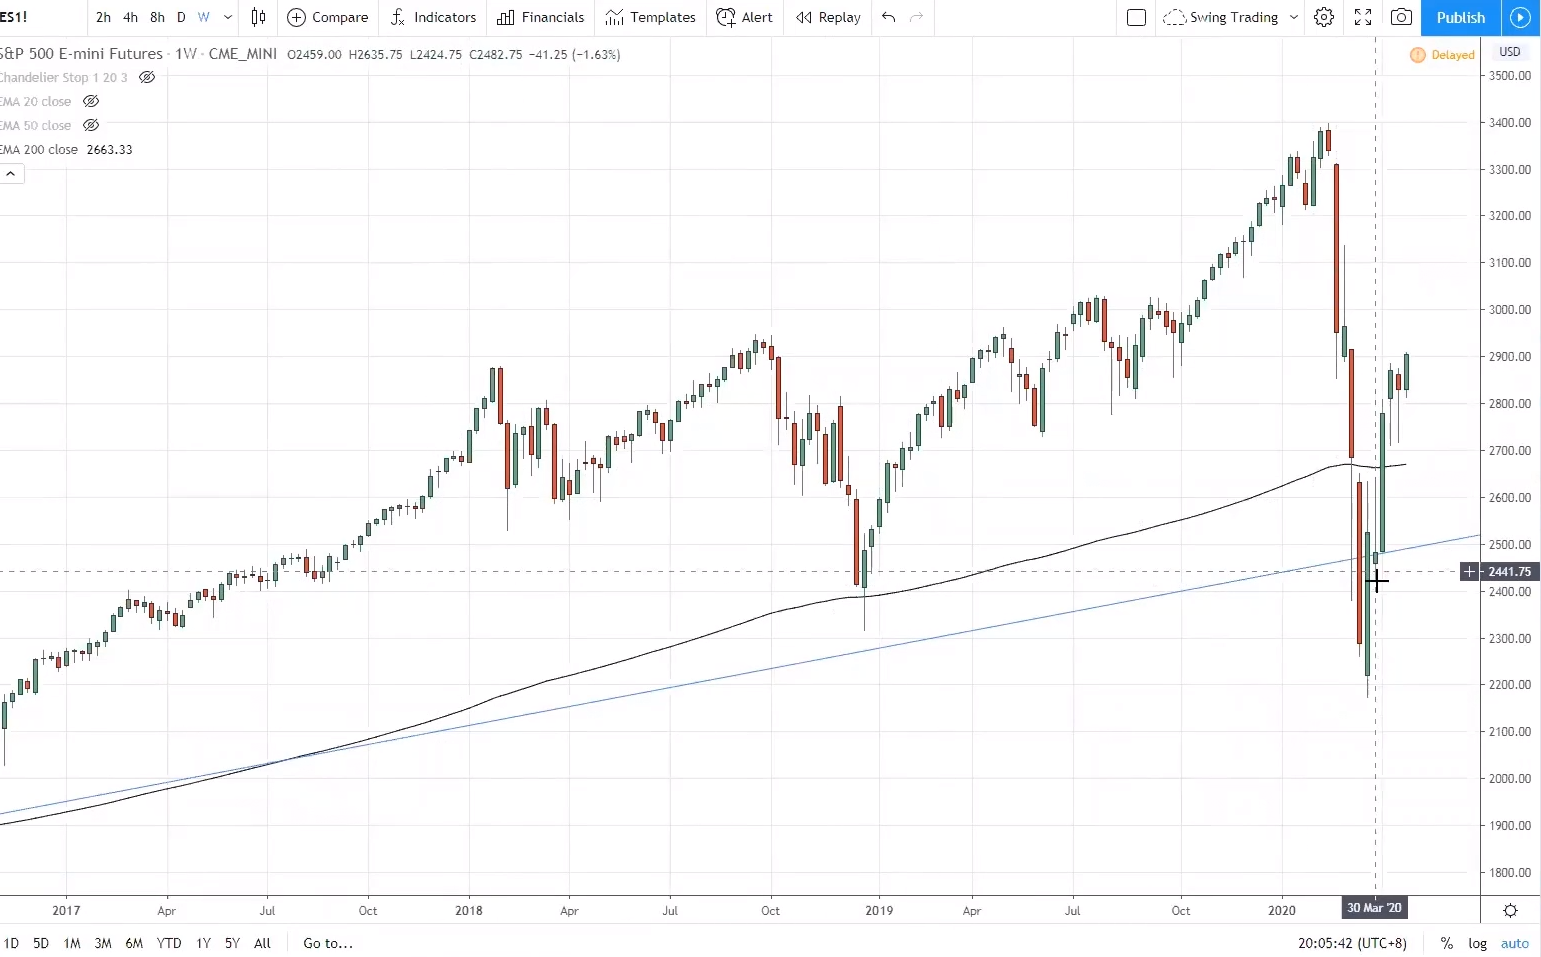
When the price pulls back, and retests previous resistance turned support and is aligned with the upward trendline, that to me has a higher probability.
Like the S&P 500’s bullish reversal:
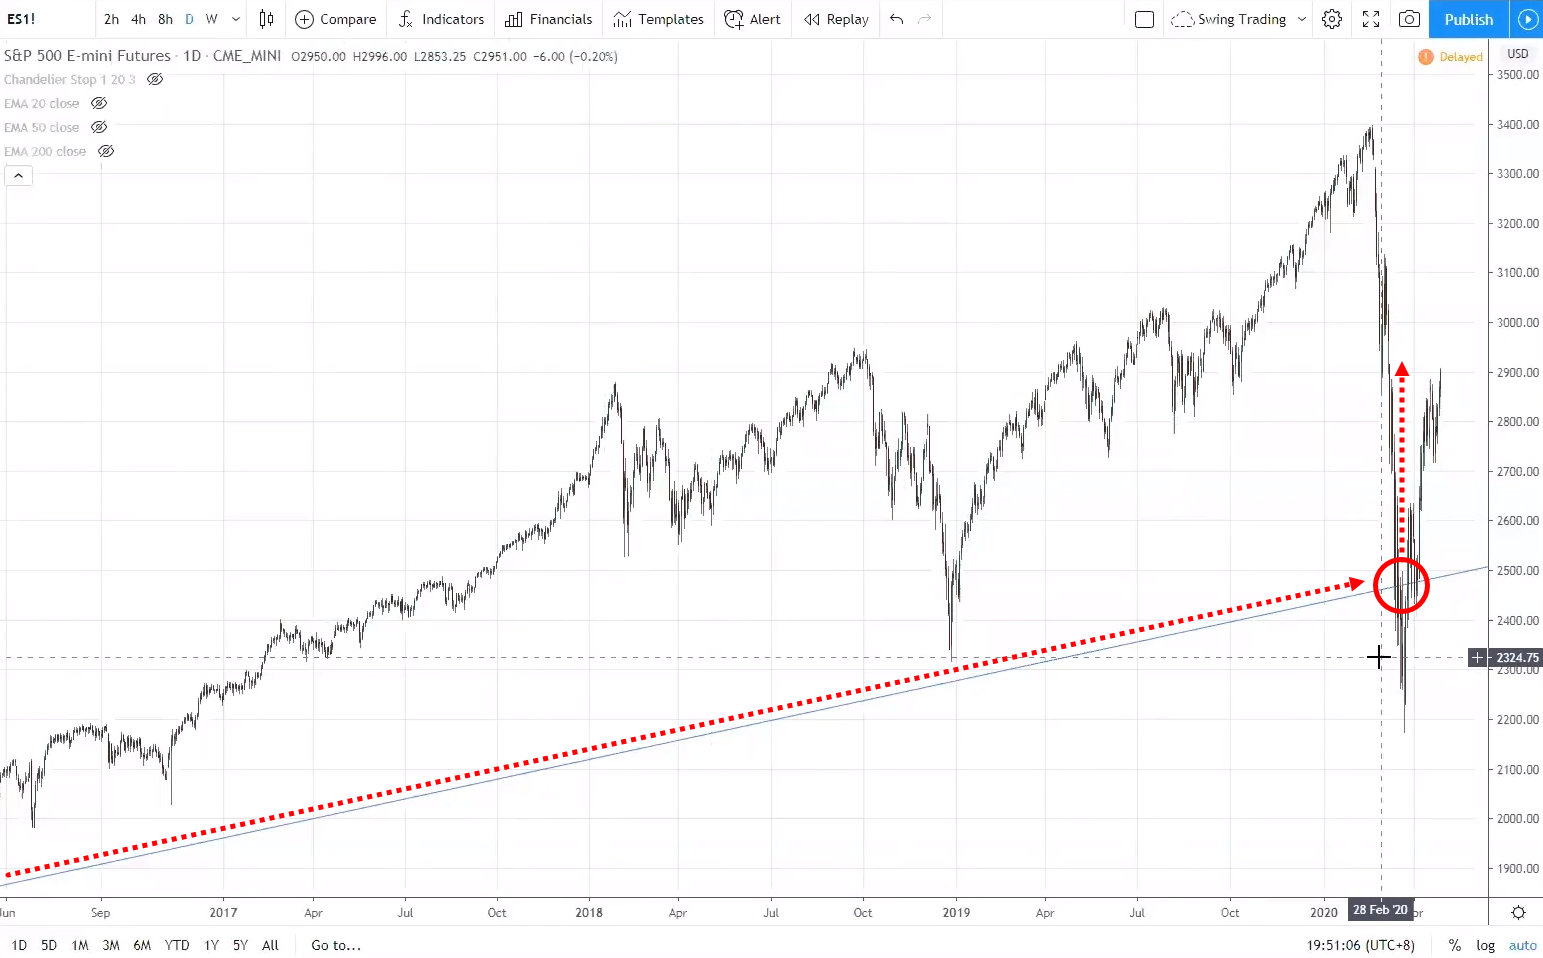
It has the confluence of the upward trendline and the area of support. This is a powerful combination.
What’s your trading routine like?
My trading includes price action trading and systems trading.
For price action trading:
In the weekends, I analyse the markets for potential trading setups for the coming week. I look at mainly the 4-hour, daily and weekly timeframe charts.
Once I have that, I’ll highlight those markets I want to focus on my Trading View watchlist.
For systems trading:
Each day I would download the overnight data, feed it into the platform, and it will give me the orders for today, and I’ll input those orders into the broker that I use.
That’s how my trading is like each day.
What’s the biggest “Aha!” moment for price action trading?
There really isn’t one big moment, it’s a combination of many such moments.
Here are a few:
- Not trading when the market is over-extended from the area of value.
- Not trading when the market is over-extended from the area of value.
- Don’t set stop loss right below support or resistance. Set a distance away from it.
- Learn how to read market structure and the different type of trends.
I find that there are many support and resistance, so which lines would you consider significant?
The levels that I consider significant are the ones that are obvious.
For example:
At a glance, you can see these 3 levels stand out and are significant levels to look at.
Yes, there are minor swing highs or lows, but they are not as obvious as the ones I have over here.
As a price action trader, do we have to pay attention to and react to the news?
If you’re trading on the 4-hour, daily timeframe, you don’t have to pay attention to the news.
I believe that the price takes into account everything that would be in the news. Of course, there are times when the news comes out and the price would react violently.
But I choose to keep things simple, I believe the price contains all you need to know. And if you’re trading the higher timeframe, your stop loss will be wider and should be able to accommodate all the swings from news release.
The key thing about price action trading is identifying the market structure, if the market is in accumulation, advancing, distribution or declining stage, then you’ll know what you need to do.
For example, if a market is in a declining stage, then I’ll look to sell at an area of value like previous support turned resistance or a trendline.
And have a plan for an exit if the trade goes right and if it goes wrong. That sums up price action trading.
What are some brokers that you would recommend?
If you want to trade stocks, I will recommend Interactive Brokers. If you want to trade many markets, you can try CMC. If you only want to trade forex, you can try IC Markets. If you are a newbie and don’t want to pay commissions, you can check out WeBull.
So it depends on what you trade and looking for the right broker to meet your needs.
Do you use any filtering or auto-notification on Trading View?
No, I don’t use any of it since I’m in front of my screen most of the time, I scan and create my watchlist manually.
The turtles used 20-day breakout initially and moved on to 40-day breakout when there was a bull-bear trap. What are your thoughts on this?
Yes in the earlier days of trend following, it’s relatively shorter-term and as time goes by, most of the trend following hedge funds are now trading off the longer-term trend with less noise and a higher chance of the trend being the real move.
That’s why for trend followers for systematic trend following, we’re trading off the 200-day breakout and that’s the reason for it. It tends to have less of a false breakout than trading off the shorter-term breakouts.
In volatile times like these when trends are changing, how do you know when is a trend reversal and not a large false break?
I have no idea, to be honest. I simply trade what I see and not what I think.
For example on the S&P 500:
At a glance, you can see these 3 levels stand out and are significant levels to look at.
Yes, there are minor swing highs or lows, but they are not as obvious as the ones I have over here.
As a price action trader, do we have to pay attention to and react to the news?
If you’re trading on the 4-hour, daily timeframe, you don’t have to pay attention to the news.
I believe that the price takes into account everything that would be in the news. Of course, there are times when the news comes out and the price would react violently.
But I choose to keep things simple, I believe the price contains all you need to know. And if you’re trading the higher timeframe, your stop loss will be wider and should be able to accommodate all the swings from news release.
The key thing about price action trading is identifying the market structure, if the market is in accumulation, advancing, distribution or declining stage, then you’ll know what you need to do.
For example, if a market is in a declining stage, then I’ll look to sell at an area of value like previous support turned resistance or a trendline.
And have a plan for an exit if the trade goes right and if it goes wrong. That sums up price action trading.
What are some brokers that you would recommend?
If you want to trade stocks, I will recommend Interactive Brokers. If you want to trade many markets, you can try CMC. If you only want to trade forex, you can try IC Markets. If you are a newbie and don’t want to pay commissions, you can check out WeBull.
So it depends on what you trade and looking for the right broker to meet your needs.
Do you use any filtering or auto-notification on Trading View?
No, I don’t use any of it since I’m in front of my screen most of the time, I scan and create my watchlist manually.
The turtles used 20-day breakout initially and moved on to 40-day breakout when there was a bull-bear trap. What are your thoughts on this?
Yes in the earlier days of trend following, it’s relatively shorter-term and as time goes by, most of the trend following hedge funds are now trading off the longer-term trend with less noise and a higher chance of the trend being the real move.
That’s why for trend followers for systematic trend following, we’re trading off the 200-day breakout and that’s the reason for it. It tends to have less of a false breakout than trading off the shorter-term breakouts.
In volatile times like these when trends are changing, how do you know when is a trend reversal and not a large false break?
I have no idea, to be honest. I simply trade what I see and not what I think.