
Which tools do you use to help predict when a range is about to form?
I really can’t predict when a range is about to form. What I can think of from the top of my head is that, if volatility is currently very high, then it’s going to be a matter of time before volatility dies down and the market gets quiet.
The volatility of the market is never static, so if you see a low volatility environment, that’s a sign that something big is about to happen, and you should be prepared for it. Likewise, when volatility is high, it will eventually die down and the market will go into a range.
That’s usually the biggest clue that the market is about to go into a range. I don’t have other tools or indicators to “predict” when the market is going to form a range.
Rayner, can you share a demo or video on trailing stop loss for trend continuation on higher & lower timeframes?
The concept that I’m sharing with you will apply across the different timeframes.
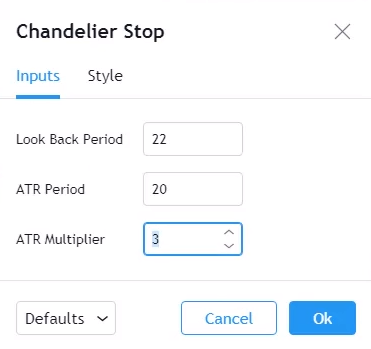
You can use a Chandelier Kroll Stop to trail your stop loss. It takes into account the volatility of the market and it adjusts accordingly.
I use 3 ATR, over the last 20 periods:
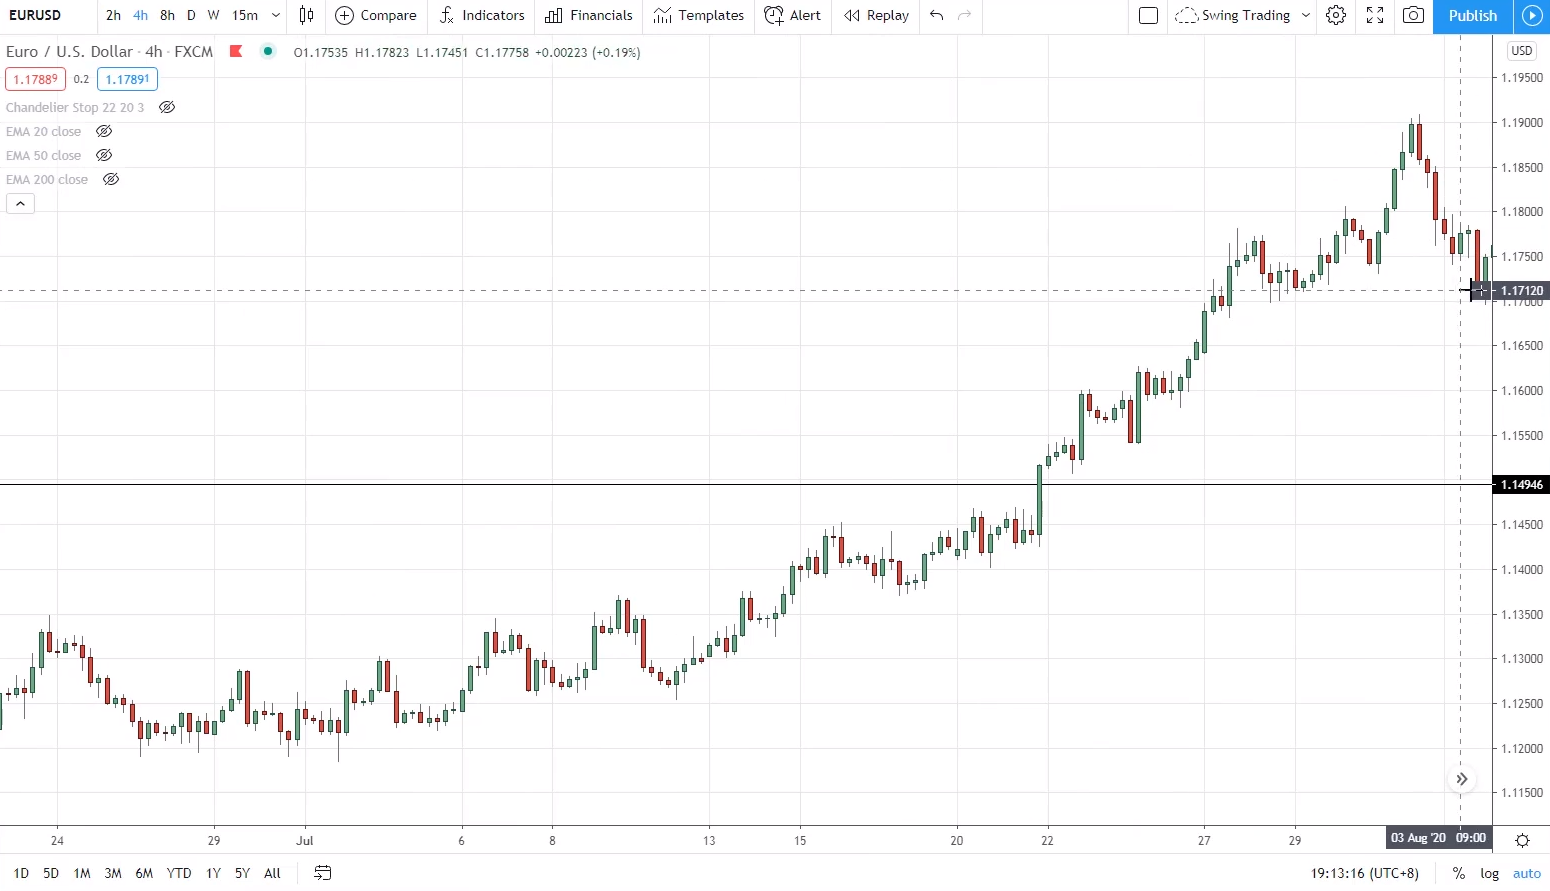
This is how the indicator looks like on the chart:
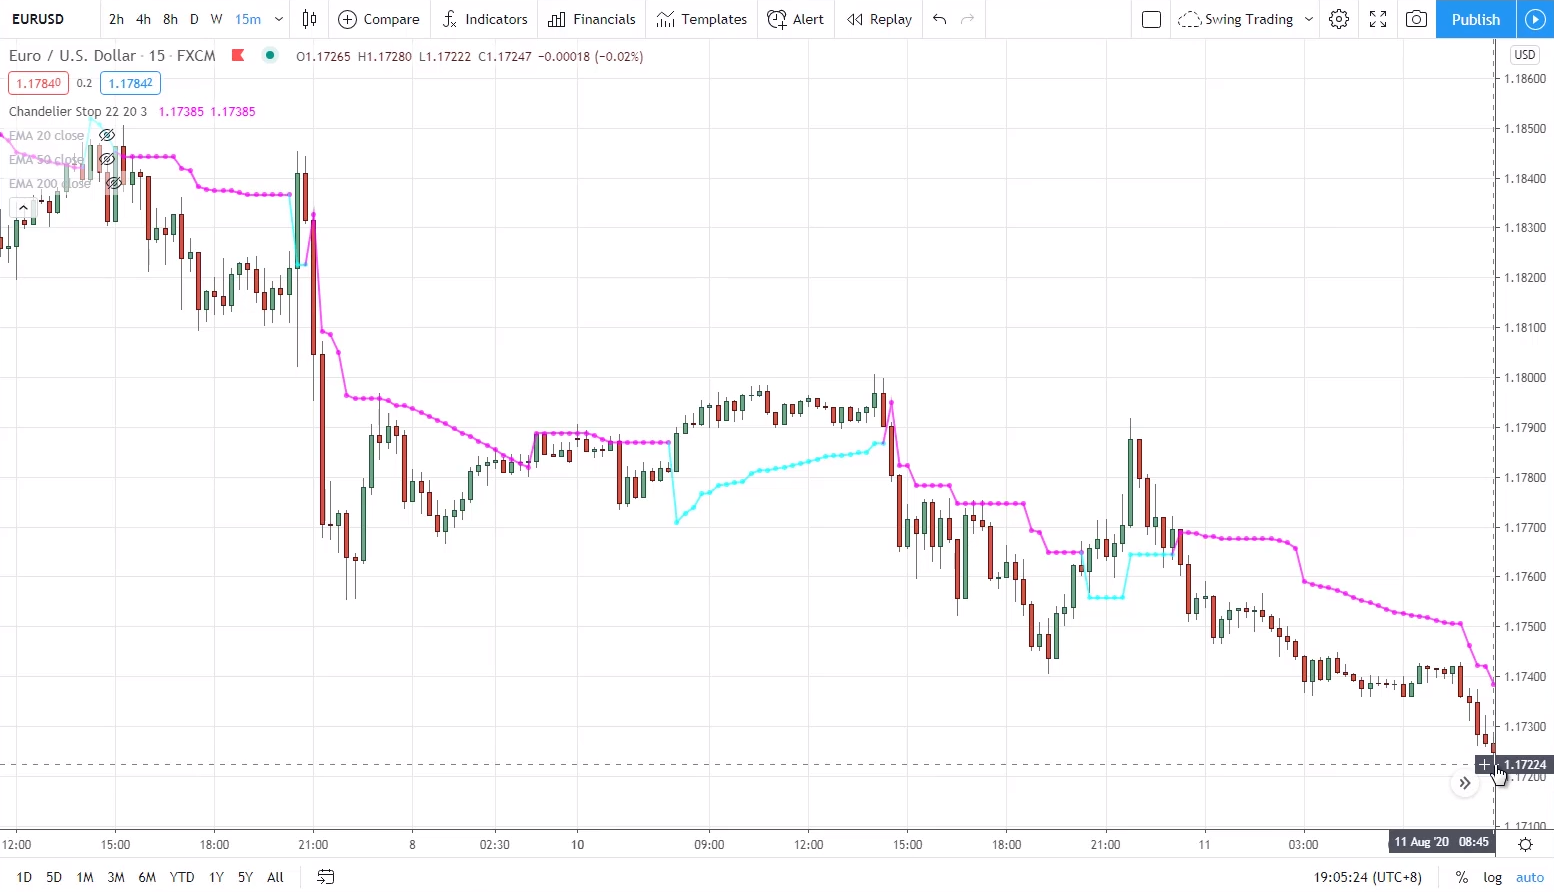
If you were to take the current price at the right here, 1.17224 and add the value of 3 ATR to it, you will get the value on the purple line which is about 1.174.
So that’s the 3 ATR buffer that you can give your trades to potentially ride the trend. You can choose to use 3 ATR like me, but if you want to ride something longer term, you can use 5 ATR instead, which offers a larger buffer for your trailing stop loss.
How you use this is very simple. When the price closes and breaks beyond the Chandelier Kroll Stop, you’ll exit the trade.
You can apply this to the 15-min, daily timeframes, etc., the concept is the same because the ATR value will be a function of the timeframe that you’re looking at. For example, if you’re using a 15-min timeframe, the ATR value will be plotted based on the 15-min timeframe’s price.
If I am trading on the 4-hour timeframe, what's the purpose and how do you use the higher timeframe, like the daily timeframe?
If you’re trading on the 4-hour timeframe, then the daily timeframe is very useful for you to get your bias, whether you should be buying or selling.
The daily timeframe is useful to also help you identify the higher timeframe’s area of value.
Let me explain.
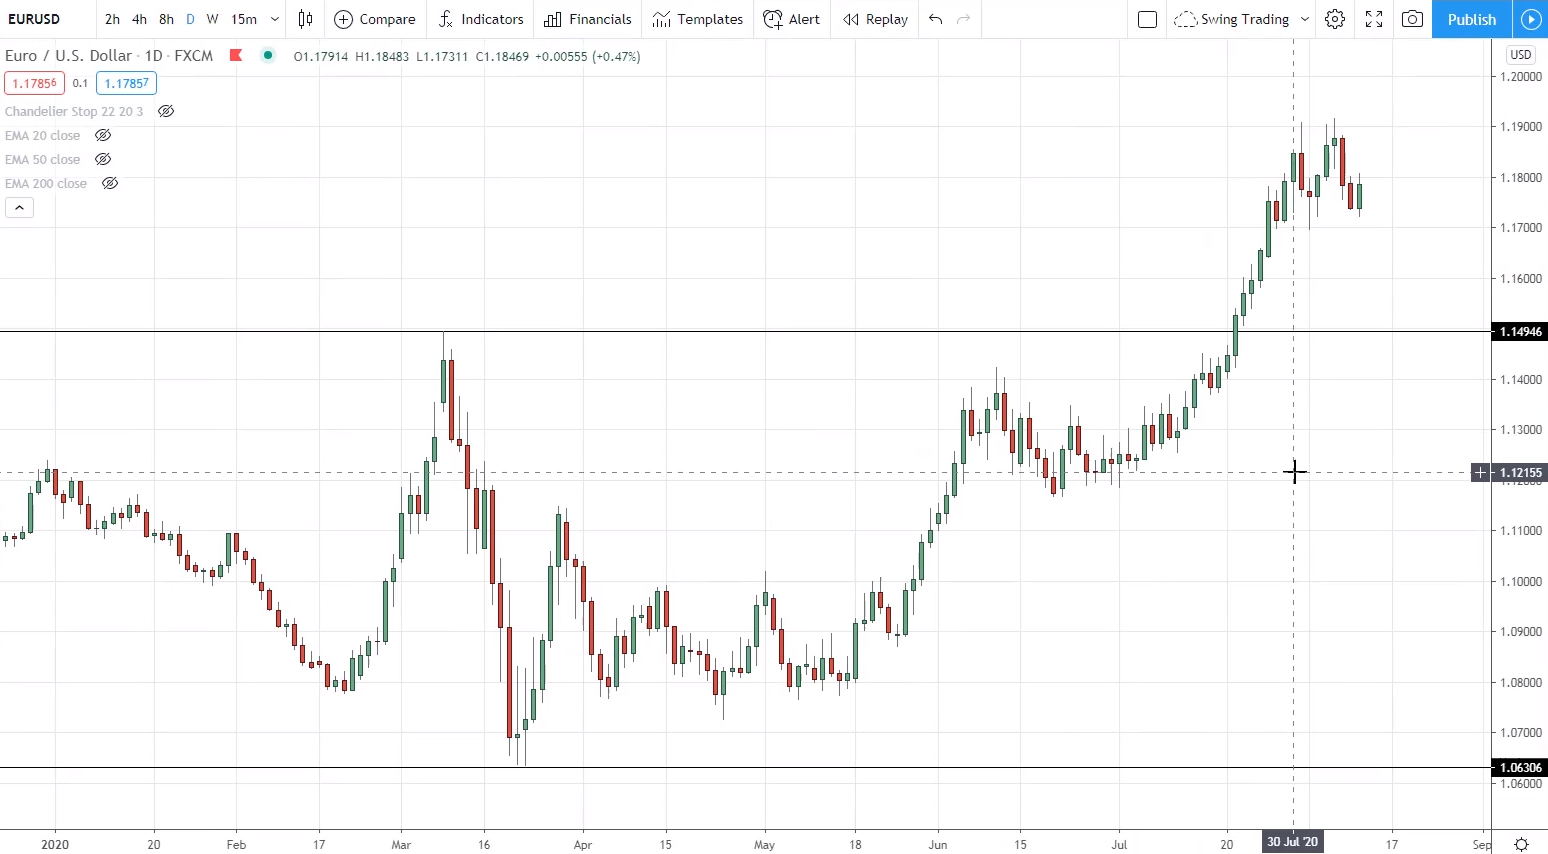
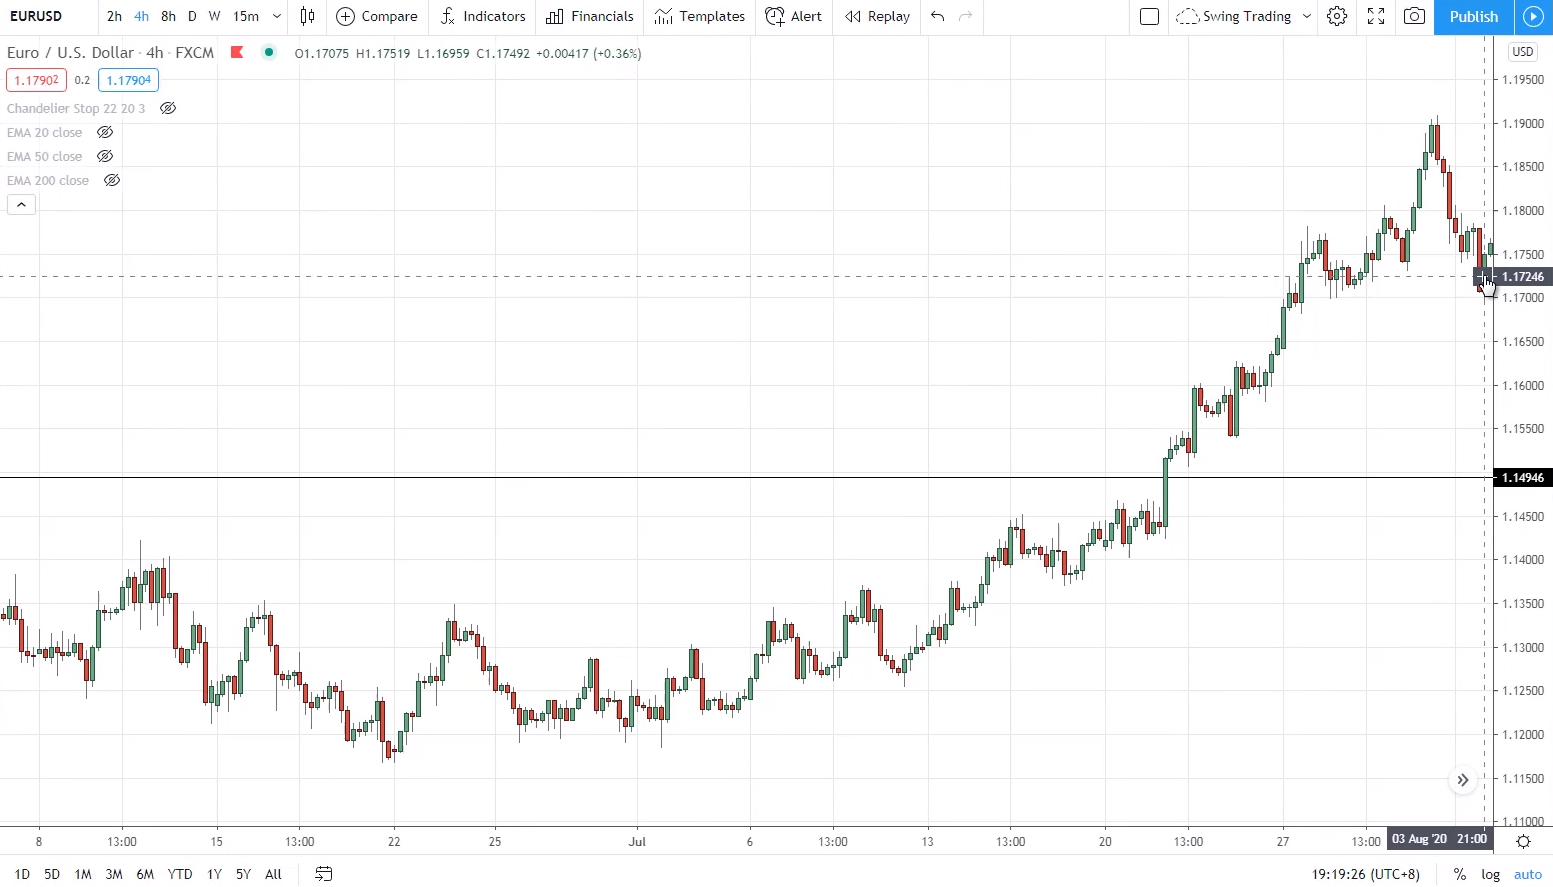
This is EUR/USD on the daily timeframe, which shows an uptrend:
So on the 4-hour timeframe, you want to be looking for buying opportunities. An area of value that’s worth looking at is this one here:
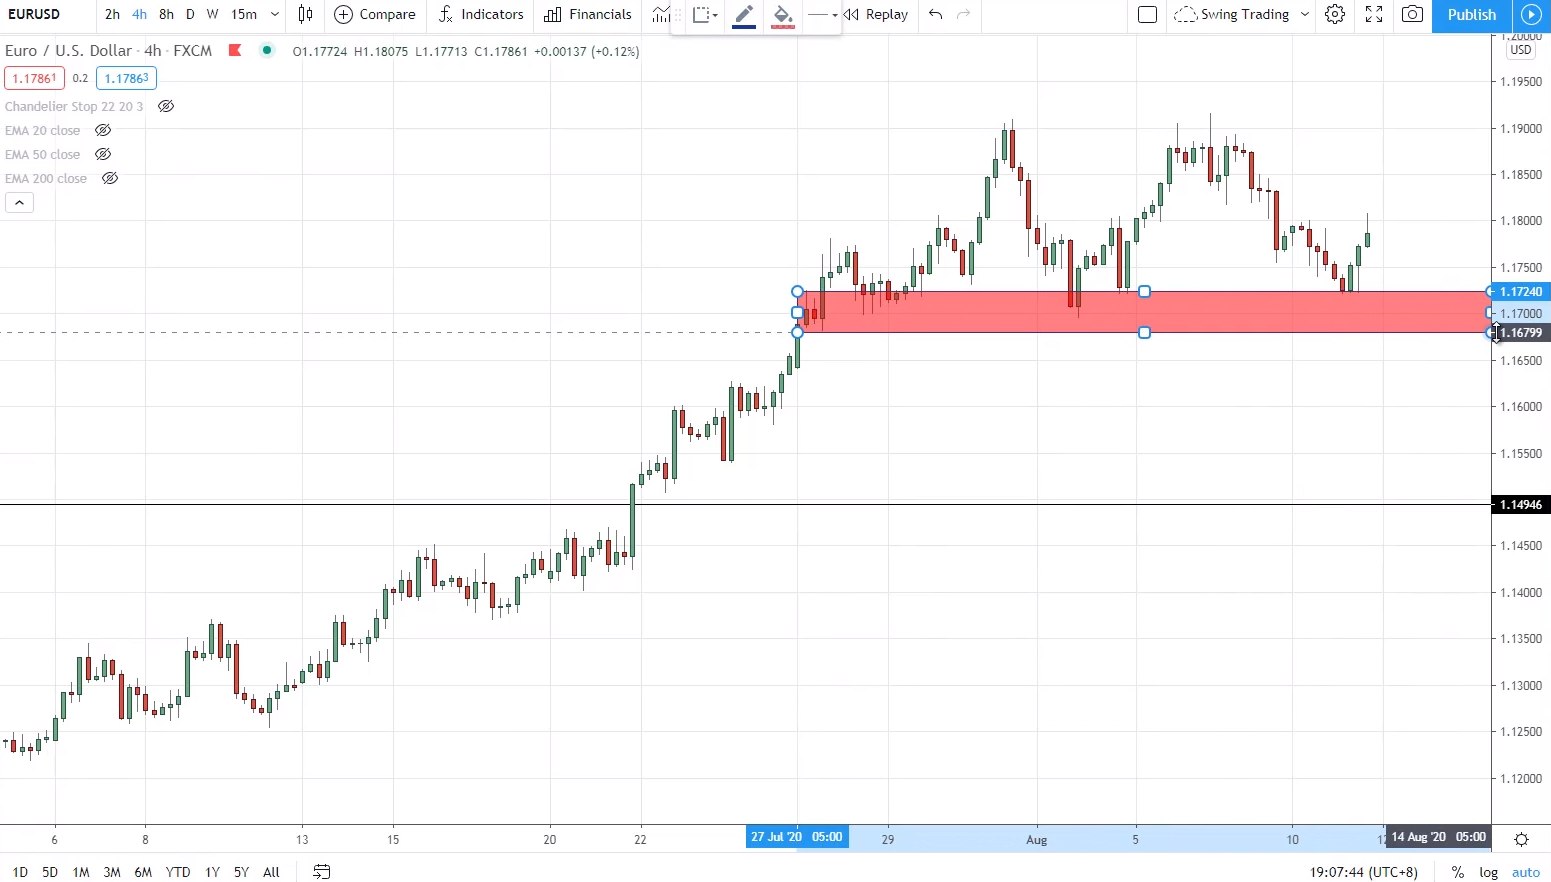
You could wait for the market to retest this area of support before you go long.
I really am impressed with your education course. Very clear and practical! In your education, it seems you trade currency more than stocks. I was curious why. To me, at least for stocks, there are fundamentals which you can use for congruence with the price action so I would think that stocks would be more advantageous, particularly with regard to trends.
For my Ultimate Price Action Trader and also for most of my YouTube videos, I use a lot of the forex markets to illustrate my concepts. But that’s not to say that I don’t trade stocks.
I trade stocks as well, from a systematic trading point of view. I have a set of fixed rules for trading stocks.
To be honest, even when I trade stocks, I don’t look at fundamentals, because fundamentals can be subjective depending on which piece of fundamental news you pay attention to. Do you pay attention to the revenue, debt, merger & acquisition, financial ratios?
The thing about fundamentals is that there are just too many things to look at.
But if you want to overlay fundamentals with price action, you can. And based on my research, you want to be paying attention to stocks that have strong momentum, meaning, those that have increased the most in price over a certain period.
These are the stocks that are in an uptrend, and these are the stocks that are likely to outperform the market over the next few months.
If you trade stocks and you’re using the Thinkorswim platform, you can rank the US stocks according to their 50-period Rate of Change (ROC) from top to bottom. The strongest performing stocks will be at the top, while the worst-performing stocks will be at the bottom.
You can look at the price action of these top-performing stocks, for example, looking for a potential false break set up, bull flag pattern, or trend continuation pattern. This is how I would trade stocks.
As for fundamentals like news, revenues, earnings, I don’t look at them at all.
What is your view about options trading as opposed to buying stocks directly?
I don’t trade options as of now, and I’ve never even placed an options trade. I only kind of know the theory behind it, so my view of options trading is very limited.
What’s the proper way to use Fibonacci?
I personally don’t use stuff like Fibonacci retracement in my own trading as well. Because I find that there are many ways to define your area of value, and using support resistance, trendlines and moving averages are more than enough for me.
So if you’re already using trendlines, moving averages, or support resistance, Fibonacci is honestly not needed.
But if you want to use Fibonacci to define your area of value, yes you can. The most common way to use Fibonacci is to draw it from a swing low to a swing high in an uptrend. You’ll draw it from a swing high to a swing low in a downtrend.
How do you set the trading size for each position? And do you take profit when the price rises?
We have lessons on both of these in the Ultimate Price Action Trader, under Risk and Trade Management. For taking profits, it generally depends on whether you’re capturing a trend or a swing. So do check that module out.
I always find my floating profit became loss (even when I follow my right trading plan). Does this mean that I have too high expectations in terms of risk and reward?
I can’t tell without seeing your trading plan, but I hope this conclusion came about after a decent sample size of trades (30 to 50 trades).
If you see your floating profit become a loss, what you can do is to take profit before opposing pressure sets in.
For example:
Let’s say you bought at this bullish green candle. Where I will look to take profit would be before this swing high here:
Because this is where potential selling pressure could come in to push price lower. So I want to be a little conservative and take profit before that swing high.
Remember, support and resistance are areas on your chart, so the price could reach right before the swing lows or swing highs before reversing altogether.
If we find a right entry point (right trend, right area of value & right candlestick pattern/chart pattern), but the reading of Currenct Strength Meter does not allow us enter (e.g AUD is stron, USD is weak), but in AUD/USD, the trend shows a bearing bais. How should we tackle this?
If the Currency Strength Meter and daily timeframe show that a currency pair is in an uptrend, like the AUD/USD you’ve mentioned, but the chart on the 15-min timeframe is showing a downtrend, then I will usually avoid trading that market.
I’ll avoid trading with conflicting information.
But if you still want to enter short trades on the 5-min or 15-min timeframe for AUD/USD, then you want to have a conservative take profit level. Don’t try to hold the trade to ride the trend.
Because chances are, this market will continue higher instead since the daily timeframe is still in an uptrend.
Please can you explain and elaborate more on correlation pairs? Where do we see them and how should we avoid them to minimize our risk exposure?
Correlation is pretty common in the forex market, like the AUD/USD, AUD/JPY, EUR/AUD, it’s all against the Aussie.
Scenario 1:
So, how you want to minimize your risk exposure is this, let’s say you’re long AUD/USD and you have another trading setup on AUD/JPY.
But since you’ve already long AUD/USD, you can choose to forego that AUD/JPY trade. Because if you buy the AUD/JPY as well, then you’ll have two currency pairs which are correlated. So that’s the first option – trade one and ignore the rest.
Scenario 2:
Another scenario that could happen is that you’re on the sidelines and not on any trades, and you have trading opportunities on both the AUD/JPY and AUD/USD, and you’re wondering which one you should trade.
What you can do is to reduce your risk per trade. Let’s say you usually risk 1% on each trade, and now you have two trading opportunities, so you can now risk 0.5% on each of these two different trades instead. This way, your risk is still capped at 1%, makes sense?
Hey Rayner, you often suggest using the Chandelier indicator or a moving average as a trailing stop loss. But sometimes the stop loss that’s 1 ATR away from the entry signal might be further away than the Chandelier indicator or the Moving average. So when does it make sense to switch from the 1 ATR stop loss to the triggering stop loss once the trade goes in the right direction?
I almost always use the 1 ATR stop loss, which could be 1 ATR below the swing low or above resistance.
The Chandelier Kroll Stop only comes into play when my first target is hit.
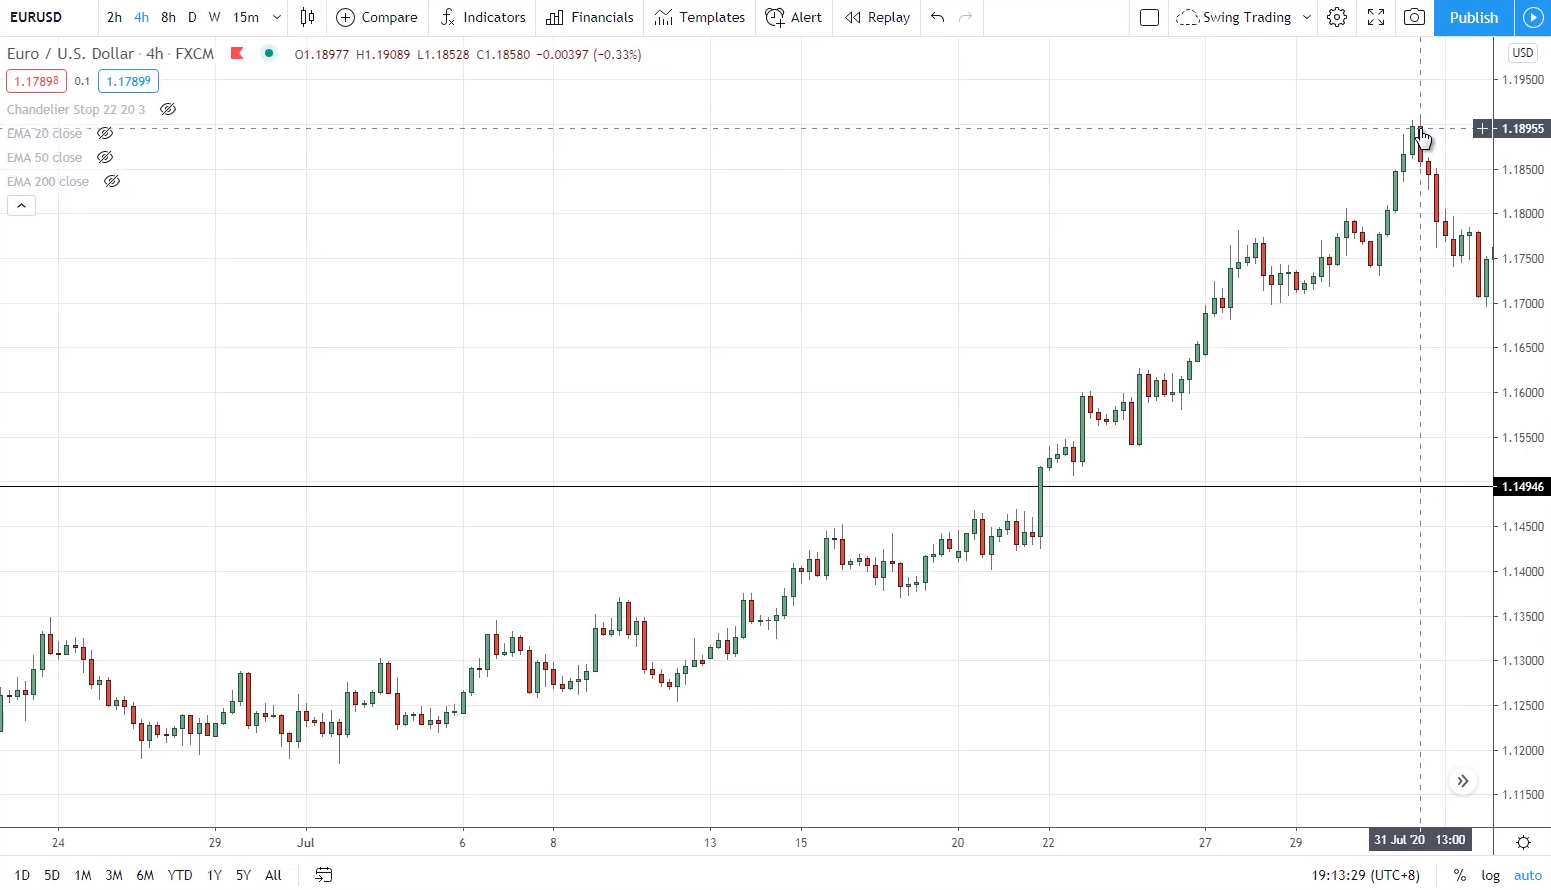
For example (EUR/USD):
Let’s say I bought at this 1.17246 level here. Then my first possible target would be at this swing high over here at 1.18929:
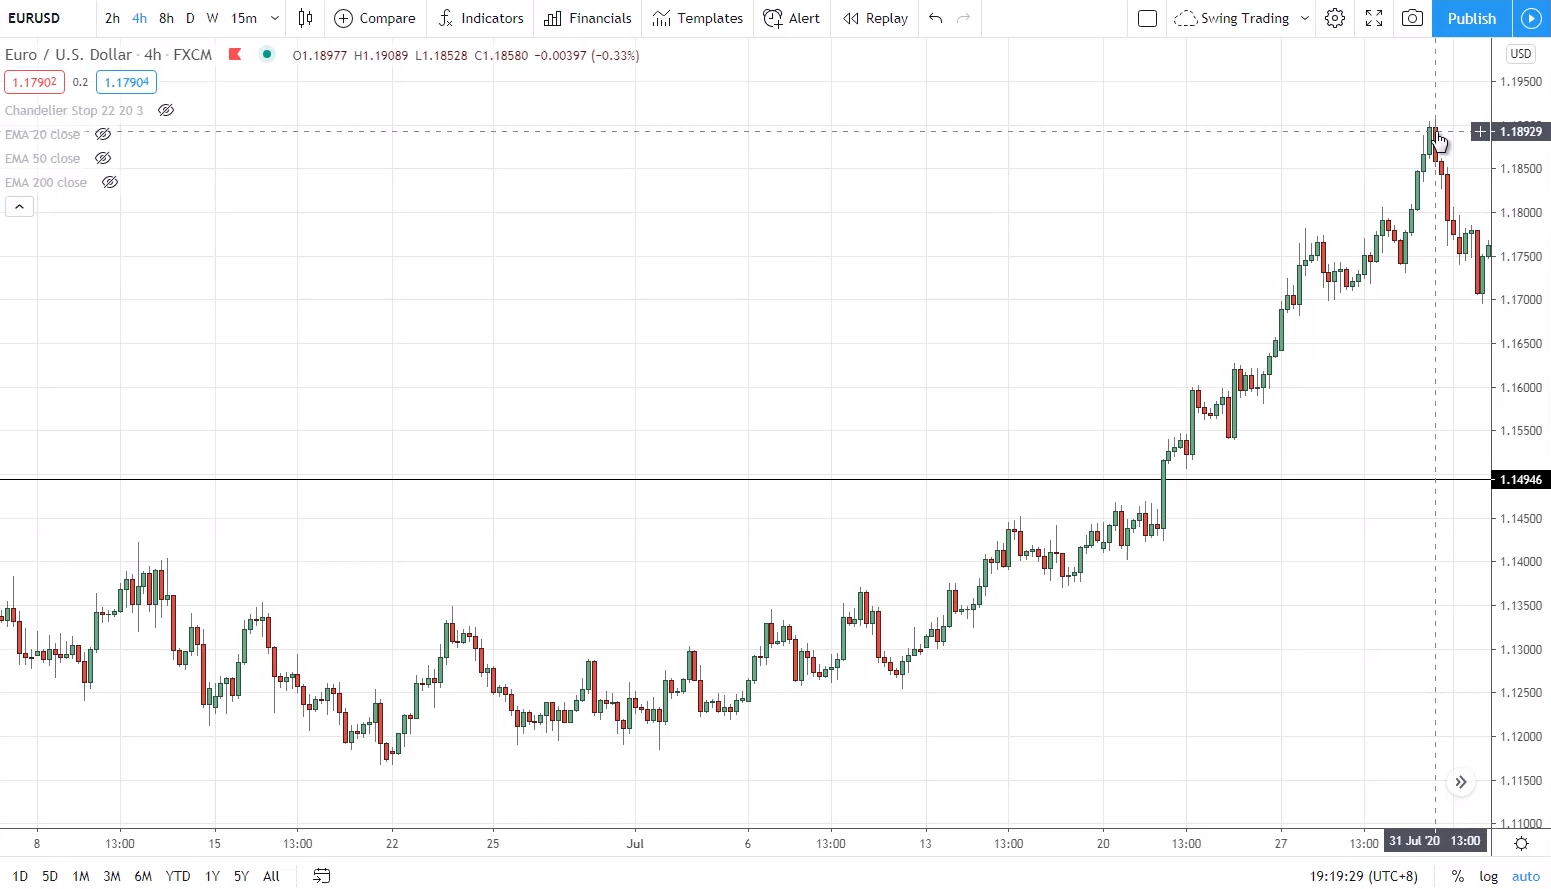
So once the trade hits that swing high, my first profit target is met, and I will exit half of my position. That is when I will pull out the Chandelier Kroll Stop and start to trail my stop loss for the remaining position.
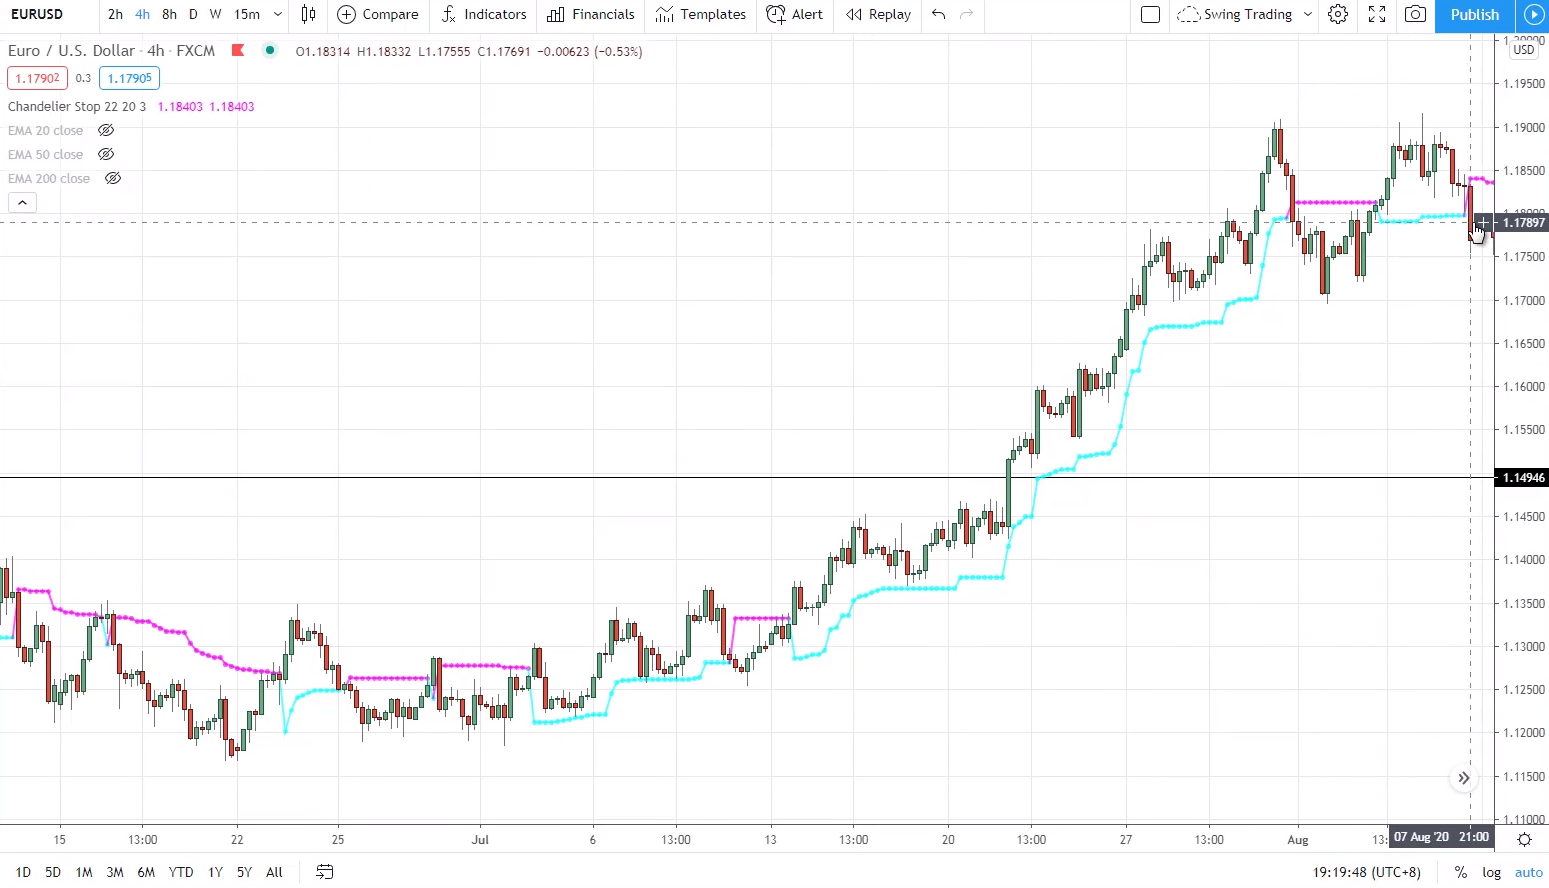
So eventually, when the price closes below the blue line, I will exit my remaining position.
Hey Rayner, does the spread of the currency pair make a difference to our trading?
Yes, some exotic pairs like USD/MXN or USD/NOK will have large spreads. These are the markets which you don’t want to be day trading because the spread will kill your trade.
Imagine you have 100 pips stop loss, and you pay about 25 to 30 pips just for the spread, it’s ridiculous.
So for day trading or short-term trading, avoid trading these kinds of exotic pairs with wide spreads.
The only time when you can trade these kinds of exotic pairs with wide spreads is if you’re trading off the daily or weekly timeframe. That might make sense because the spread will only be a small fraction of your stop loss.
Because let’s say if you’re trading on the daily timeframe, you’re buying the USD/MXN, your stop loss could be like 500 pips. Then if the spread is like 30, 40 pips, that’s still quite reasonable, probably 10% the size of your stop loss, so it’s still reasonable because of your wide stop loss.
We're all learning the support and resistance, so everyone will be waiting at these levels, but sometimes it doesn't come to your favour. So what's another good approach for this type of trading?
This is where the market structure comes into play. As you know, we define trends into three categories:
- Strong trend – price tends to respect the 20 MA
- Healthy trend – price tends to respect the 50 MA or previous resistance turned support
- Weak trend – price tends to respect the 200 MA and respect support resistance
So it’s important not to only focus on weak trends or support resistance market or range market conditions. Because in a strong trending market, the price may not reverse to the levels that you’re looking at.
This is why you want to understand the different types of market structure, the accumulation stage, the advancing stage, the distribution stage, the declining stage. And also understand the different types of trends because that’s where you find areas of value in those markets.
I noticed that when the timeframe used for trading is too low, for examples, 1 hour, 15, 10 or 5-minute timeframe, their benchmark will not be the same as taught in UPAT. Some of the benchmarks used in UPAT for example, moving average are used in the daily or 4-hour timeframe to determine if the trend is strong (<20 MA), healthy (>20 and < or touch 50 MA) or weak (> 50 MA)? But if I used shorter timeframe (1-hour, 15, 10 or 5-minute timeframe) the MA might not be the same as the daily or weekly timeframe to determine the strength of the trend. This is just one example and there is another benchmark used in UPAT. Does it mean all these shorter timeframes (1 hour, 15, 10 or 5-minute timeframe) are not suitable to be used for trading if we want to use the benchmark mentioned in UPAT? Should I use daily or 4-hour as the trading timeframe to be consistent with UPAT? Kindly advise.
Here’s the thing, when I use the 20 MA, 50 MA, or even the 200 MA on the 4-hour or daily timeframe, what I’m trying to illustrate is the concept. If you see that price is above the 20 MA, then the market is in a strong uptrend in the 4-hour timeframe.
If you see that the price is above the 20 MA on the 15-min timeframe, then there’s a strong trend on the 15-min timeframe. So the concept applies.
If you see a strong trend on the 15-min timeframe, and the price is above the 20 MA, then you can look to buy when the price retraces to the 20 MA or you can even look to buy the breakout.
The concept is the same, just that the difference is in the timeframe. What we’re focusing here is the concept.
If the price is above 20 MA on the 4-hour timeframe, it doesn’t mean that it’s in a strong trend. It doesn’t mean that if you look at the 15-min timeframe and the price is above the 20 MA, then that’s not in a strong trend. No, it’s still in a strong trend. It’s just a matter of timeframe.
The concept can be brought over from one timeframe to another. So, understand the concept, and you’ll be able to trade the different markets and timeframes.
For example, a 200 MA on the 5-min timeframe. If the price bounces off the 200 MA on the 5-min timeframe repeatedly, then you can say that, on the 5-min timeframe, that trend is a weak trend.
How to grow a small account using just one strategy? And also, what’s the habit to do a market analysis? I am still new and a bit confused on some of the steps. Thank you.
If you want to grow a small account, don’t focus on the money first. Instead, focus on developing your trading strategy and getting that edge of yours, through that specific trading setup or strategy.
With a small account, of course, you can’t be risking a lot, like $500 or $1,000 per trade. So if you’re trading forex, I hope you’re using nano lots to reduce your position size to a point where risking 1% of your account is still doable.
Once you’ve mastered your strategy and found your edge in the markets, the next thing is to regularly add funds into your trading account, because that’s the only way you’re going to grow your account.
Yes, you can compound your returns, but it will take a long time to grow that small account. So what you want to do is to regularly add funds into your account, to scale up that account. Together with compounding, that’s how you grow your small account.
For the market analysis, it boils back down to the trading strategy that you have. Do you trade reversals, trend continuations, false breaks, etc. Once you know what setups you’re trading, then all you need to do is to look for those setups on the markets that you trade.
That’s what I do weekly on the market analysis videos. You can check that one out and see my thought process and how I identify trading opportunities in the markets, and how I put those into Excel spreadsheet and create my watchlist for the upcoming week.
Scenario: On the daily timeframe, we see a buildup (uptrend) with stop loss 100 pips at the nearest hiher Lows. We then seek entry on the 4- hour timeframe, and we found out another higher lows, which the stop loss is 50pips. Which stop loss should we use, the one on the 4-hour or daily timeframe?
It depends on which timeframe are you trading on. If you’re trading the daily timeframe, and you find a buildup on the daily timeframe, and you want to buy the breakout, then you want to refer to the 100 pips stop loss.
But if you trade on the 4-hour timeframe, then you want to go with the stop loss that you’ve mentioned.
So it all depends on the timeframe you’re trading and your trading setup.
I was primarily an indicator guy (e.g. moving averages + RSI) before taking UPAT. As a result of taking UPAT, I can now read the price action much better than before, and this has made me a better trader. I now need to integrate my recent learnings from UPAT. My questions: What is your take on how to best combine price action and indicators? For example, do you use price action to find a setup (e.g. buildup) and the indicator as the signal to act (trigger) or the other way around? I suppose what’s implied in my question is that price action setups drive indicator signals. Therefore, if an indicator gives you a signal (e.g. price crosses above 50-day MA) and there’s no underlying price action set up, then don’t trust the signal and vice versa? On the other hand, sometimes I see an indicator signal (e.g. stochastics hooking up from oversold) take place before a price action setup is complete (e.g. false break test of a trading range bottom). In this case, the stochastics was the setup before the setup! Should the signal and false break be combined as a "holistic setup"? Would appreciate your comments.
Let me start by sharing how I combine indicators with price action. As a price action trader, the first few things I do is to:
- Identify the market structure – is the market in an uptrend, distribution stage, accumulation stage, etc.
- What type of trend is this – strong trend, healthy trend, or weak trend
- Where’s the area of value – is it at support, trendline or moving average
- What’s a valid entry trigger if the price comes to my area of value – could be a hammer, engulfing pattern, etc.
- Stops, targets and trade management
You can see that indicators at this point, didn’t really come into play because the basis of my thought process is based on price action.
However, indicators are useful because they can help you identify your area of value. For example, the 50 MA is useful to help you identify an area of value for a healthy trend. The 200 MA is useful in a weak trend.
The ATR indicator is useful to help you set your stop loss, it could be 1 ATR below support or above resistance, etc.
So I don’t use indicators as a basis for my trades, I use these indicators as a basis to help me define my area of value and to set my stop loss. But whether to buy or sell, when to buy or sell, it’s all price action and not indicators.
The indicators are kind of secondary. Price action is still the primary one. So for your question, should you wait for a false break with stochastic oversold, I would say it’s not needed. If there’s a false break setup, you can simply take the trade. Price action comes first before indicators.
Would you consider offering a new course that teaches traders to combine price action analysis with indicators? It could be an advanced course for graduates of your UPAT or Ultimate Systems courses. Keep up the great work!
Right now, I would say no, because I don’t have any more value to add in terms of price action combined with indicators. Because all that I’ve used are already taught in the UPAT, like using moving average to define the area of values or ATR to set stop loss.
These are all taught in the UPAT, and these are things I use.
Sure, I could start another course to teach all about the indicators out there, but those are probably indicators that I probably won’t use, and I don’t feel charging money for something that I personally don’t use.
So, I’ve pretty much shared all that needs to be shared about price action trading with indicators in the UPAT.
For a trade, do you wait for full take profit or do you close partial when it reaches 50% of your TP and put stop loss at the entry to secure a little profit?
As of right now, I usually take half my profits at my first target, which could be before resistance or swing high, and then trail my stop loss for the remaining half of my position.
That also depends on the context of the markets. Because if I know that I’m trading against the trend on the higher timeframe, I will just exit everything at a swing high or low.
But usually, I tend to trade in the direction of the higher timeframe trend. So I’ll exit 50% at the swing high and trail the remaining to ride the trend.
So, I don’t set my stop loss at entry to secure a little profit, I set it at the original stop loss level, but this time around, I am trailing my stop using the Chandelier Kroll Stop.
Based on my experience and opinion, price trading approach is quite subjective. Are there any indicators you recommend that I can use (trend and volume indicator) to help improve my trading decision?
If you find price action trading subjective and you’re not comfortable with that, and you want something more objective, I recommend trading in a systematic approach, otherwise known as rule-based trading.
We have something called the Ultimate Systems Trader which you can check out. You can email support@tradingwithrayner.com, and we can do what we can do about it.
But why I don’t use trend and volume indicator to make price action trading more objective, because here’s the thing, price action trading is a form of discretionary trading.
And no matter how much more tools and techniques I share, there’s still bound to be an element of subjectivity, for example, drawing support and resistance, trendlines, defining healthy or weak trend, etc.
So if you want something more objective, then go with a more systematic trading approach to yield a better outcome in the long run.
How do I determine my optimal lot size? It seems that I have experienced losses in Forex trading because I have very small lot size with high expectations (in riding the trend). Do you have any advice on this?
Your optimal lot size depends on your risk management. I advocate not risking more than 1% of your account on each trade. And how many units of the currency do you buy such that your account does not risk more than 1% is dependent on a few factors.
1. The size of your stop loss
The wider your stop loss, the smaller the number of units you can buy. The smaller your stop loss, the greater number of units you can buy.
2. Risk per trade in terms of nominal dollar value
If you have a higher nominal dollar value because you have a larger account, then you can risk more units. We cover this under Risk & Trade Management under the UPAT. So check that out, that should help you calculate the position size on each trade.
In price action trading, are we allowed to use indicators to help guide us and improving our trades?
Of course. Price action trading doesn’t condemn or ban indicators. All we are doing is reading the price action of the market to know when and where to buy or sell.
Indicators have a place in our trading, especially in defining our area of value and setting or trailing your stop loss. These are all things that shared in UPAT, but these are secondary.
Because to know when and where to buy or sell is still all about reading the price action of the market. Indicators are secondary, to assist you in your trades.
Price action should be able to apply on different timeframes. However, I faced difficulty applying price action on lower time frames like 1-hour and 15-min timeframe. The price whipsaws more frequently, and at times before I could see an entry trigger it becomes too late and my stop loss becomes too wide to take the trade. 1) Is there a more effective way to catch the price actions earlier, or 2) Is there a way I can make use of these lower timeframe to find my entry for the higher timeframes. I believe you do have a YouTube video on these but I am unable to catch these moves. Either I'm too late, or after entering the trade I realized that at the higher timeframe I'm actually trading against a pullback.
Let me walk you through how to apply the concepts even to the lower timeframes. I don’t personally trade the 5-min or 15-min timeframe, but I want to show you that the concepts can be applied the same.
Here’s an example (S&P 500 E-mini Futures):
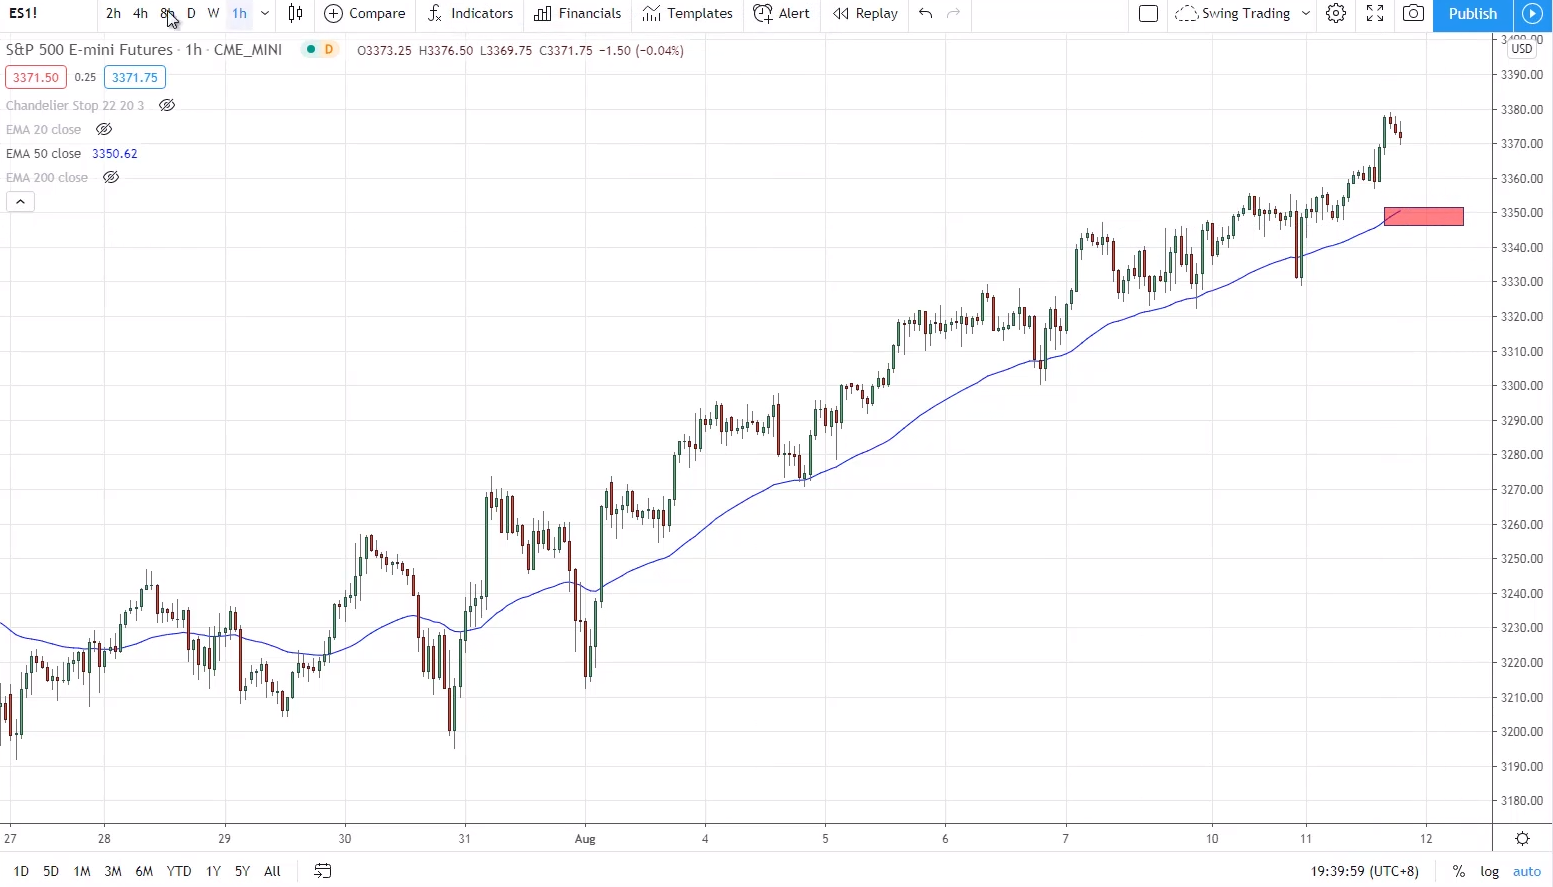
On the 1-hour timeframe, this market respects the 50 MA and the red area is a possible area of value. So now let’s head down to the 15-min timeframe.
What I’ll do is I’ll wait for the price to show a bullish price action at the area of value on the 15-min timeframe. One thing to note is that this area of value is going to be dynamic since we’re using the 50 MA on 1-hour timeframe to define our area of value.
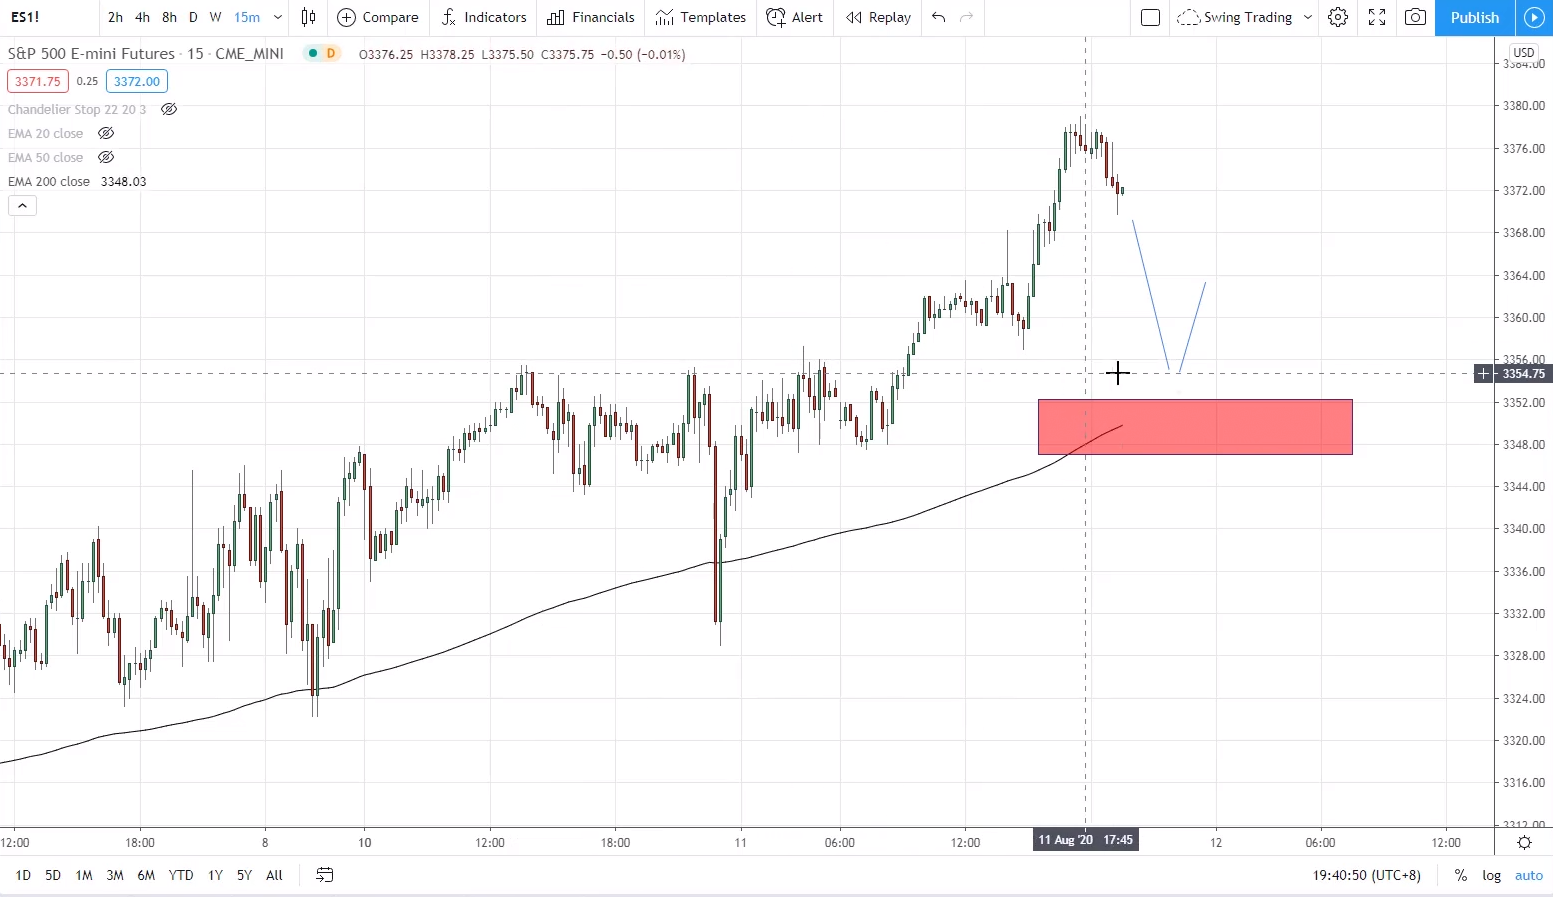
The area of value will continue to inch up higher over time. So if you convert the 50 MA on the 1-hour timeframe, then it will become the 200 MA on the 15-min timeframe, which is the black moving average.
I want the price to reach that area of value, which could become resistance turned support, and also the black line touching the price, so we can have multiple confluence on the trade.
Then for entry trigger, I can look for something simple like a false break setup to go long on the next candle open. My stop loss can be 1 ATR below the swing low and the possible target profit could be at the previous swing high.
Again, it’s the same concept that I do on the daily timeframe.
So if you’re always missing the trades, and you still want to trade on the 15-min timeframe, then you have to be watching the market every 15 minutes to see if you have a valid entry trigger to go long. That’s the price to pay if you want to be trading on the lower timeframe.
Also, on TradingView, what you want to be doing is to create a watch list and to set price alerts to notify you when the price has crossed certain levels:
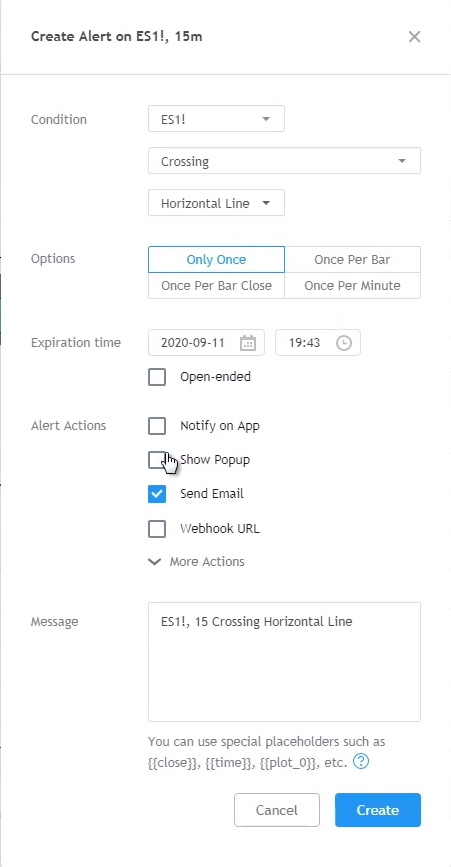
So these would be helpful for you as well to make sure you don’t miss trading opportunities.
Do you have any systematic trading strategy solely for forex besides the mean reversion trading?
As of now, no I don’t have a systematic trading strategy to solely trade forex.
How reliable is the 50% retracement? I have seen many times that the price retraces to 50% Fibonacci level before resuming the trend again.
To be honest, I’ve not done any research or testing, or articles that talks about it and backs it up with statistics and data, so my answer is, I don’t know.
My price action is showing buying, but I can see strong weekly resistance is coming. What shall I do? Shall I wait for the price to break weekly resistance or go ahead with my plan?
Then the key question to ask yourself is, what is your trading timeframe? Because if you’re trading on the 1-hour timeframe, you could possibly enter the trade and maybe hit your profit target level even though you’re buying right smack into weekly resistance.
That’s because the weekly resistance is a wide area, which could be a few hundred pips. So you could have entered and taken profit even though it’s nearing weekly resistance.
For someone considering forex as a retirement plan, do you recommend UPAT or UST?
UPAT and UST are catered to 2 different groups of traders. UPAT is for traders who want to adopt a price action trading methodology, to trade using support resistance and for those who enjoy the intellectual challenge of analyzing the markets.
For UST students, they are people who don’t want to analyse, they want objectivity, they want black and white rules.
So it depends on whether you want to go with a discretionary approach or a systematic approach.
Recently, when I entered a trade, I made a short bid and initially, the price moved in my favour. It started to reverse just short of my profit target and begin forming an ascending triangle and then broke out of the triangle with an upward movement. My question is, is there really no scenario where you will exit earlier than what you’ve planned for? Especially if you see the trend changing, would it not be reasonable to exit earlier for those circumstances?
I get what you mean, you short at resistance and then price forms an ascending triangle against you. I would say that’s a special situation if you see that, then I can agree that it’s fine to exit that trade ahead of time.
But you have to bear in mind, that if the ascending triangle doesn’t break higher but instead continues lower according to your trading plan, but you might feel bad for exiting your trade earlier.
The key question here for you here is which one will hurt more:
- Exiting the trade earlier only to see the market continue moving in your favour?
- Or having the trade hit your stop loss?
Whichever is more painful for you, then you’ll take the path of action that is the least painful for you.
Personally, I’ve encountered that scenario a few times. What I do is I held onto the trade until the price broke out at resistance and the ascending triangle to hit my stop loss until I am out of the trade.
The reason is since I’m trading in line with the overall downtrend, my take is that the trend is likely to continue.
You talked about Rate of Change (ROC) in Thinkorswim to filter for stocks to trade. Does this also exist in TradingView?
I don’t think TradingView has that feature from what I know so far.
If I’m trading stocks with 1% risk per trade and the commission is let’s $10, my stop loss will have to factor in the $20 commission for entry and exit of the trade. How then do I calculate a reasonable profit margin to be profitable?
Nowadays, you have Robinhood, WeBull with zero-commission trading, so hopefully, those brokerage helps you with that, and you don’t have to be paying $10 or $20 for commission.
Otherwise, if you still have to pay commissions, then what you want to do is to make sure that your spread plus commission is not more than 10% of your target profit.
Let’s say if everything is $20, then you want to make sure that your target profit is a minimum of $200. So even though you have to pay $20 for transaction cost, you still have the remaining 90% to take as net profit. 10% is just a general guideline from me.
What’s the difference between a systematic versus discretionary trading?
For discretionary trading:
You still have a trading plan and you are guided by a framework. For example, it could be something like:
If the price is in an advancing stage, then identify the type of trend.
If the type of trend is a healthy trend, then look for buying opportunities at the 50 MA or at previous resistance that could become support.
If the price retraces to the 50 MA, then you could look for a bullish engulfing pattern to time your long entry.
If you’re long, you can have your stop loss 1 ATR below the engulfing pattern and take profit at the nearest swing high.
The key things for a discretionary trader are:
- Timeframe – which timeframe to use
- Your entry trigger – some people want the bullish engulfing pattern to be 1.5 ATR
For systematic trading:
It could be something more straightforward like:
If the price is above the 200-day moving average and makes a new 50-week high, go long with stop loss 6 ATR from entry.
The rules here are very black and white. You can give it to 50 traders, they should be all entering and exiting in the same manner.
But for a discretionary trading plan, the same 50 traders can execute them very differently. Some people interpret a healthy trend differently from you, or some people trade the false break different from you.
So there are elements of subjectivity for discretionary trading, compared to systematic trading where it’s much more black and white, where the rules are fixed.
Can you demonstrate how to scan for stocks using Thinkorswim?
Check out the video walkthrough above from 54:00 to 58:00.
Regarding systematic trading, do you think it’s a good idea to fund 3 different accounts to trade 3 different strategies?
Actually, you don’t have to. If you want to trade different strategies, I’m using Interactive Broker as my broker right now, and they allow me to create multiple sub-accounts, which makes it easier to track the performance and metric etc.
Is it better to enter a systems’ stop loss or track your stop loss manually after each close of the candle?
This depends.
For stock trading, based on my experience, it’s much better to wait for the market to close first before you exit your trades, because usually for stocks when the market closes bearishly, there’s usually a higher possibility of a gap up the next day, where you can exit at a better price.
But for forex, I don’t have any studies to back that up yet.
Another thing for forex is that sometimes if you use a mental stop loss, do you have the discipline to exit the trade.
Yes for mental stop loss, people say you can avoid stop hunting from the broker etc., but when the time comes to exit the trade, traders might have difficulty clicking the exit button. So you have to consider that as well.
If you find that you don’t have the discipline to exit the trade, then it’s better to go with a systems’ stop loss and it will automatically exit for you.
For trend following system, do you use Interactive Broker or CMC?
I use CMC for the trend following system because I trade certain forward markets that are on CMC. I’m not sure if Interactive Broker offers those markets like CMC.