
How do you do a trade review of your journal after the trade has been closed? What questions should I ask myself if a trade is a good or a poor trade? Thanks Rayner.
Before we do a trading journal, we must first have a trading plan which includes the market condition, entry triggers, stop loss, managing your winning or losing trades, and risk management.
So your trading journal has to be aligned with your trading plan. You have to record trades in the trading journal according to your trading plan.
Some of the metrics I record down are:
- Entry point
- Stop loss
- Exit point
- Whether that trade is a winner or a loser
- Profits & losses in terms of R (if I risked $5 to make $20, that’s a profit of 4R)
- Type of the trading setup (breakout, break of structure, false break, etc.)
To me, a good trade is one which you follow your trading plan. A bad trade is one which you didn’t follow your trading plan.
When you execute good 100 trades, it means that you’ve executed according to your trading plan 100 times. If you look at the stats, wherever you record them, you’ll know if that particular trade or setup actually yields a positive expectancy in the long run, or after 100 trades.
A good trade isn’t determined by the P&L, it’s determined by whether you’ve followed your plan or not. Because once you’ve followed the plan, then you can have a meaningful trade review.
Hi Rayner! What is the difference between the 4 stages of the market (taught in the Ultimate Price Action Trader) and Elliott Wave Theory?
The 4 stages of the market are for me to access what the current market condition is and where is the path of least resistance.
The first stage is the accumulation stage, which is a range market in an existing downtrend. This is where the smart money is accumulating their position to prepare for the second stage, the advancing stage where the price breaks out higher.
But of course, price doesn’t go up forever. So the third stage is the distribution stage, where the smart money unloads its position and the price forms a range within an uptrend.
When the price breaks below that range, it moves into the last stage, the declining stage.
Here’s the thing:
The 4 stages of the market are not meant to predict what the market will do next. Instead, it helps you classify the current price action of the market and then trade along the path of least resistance.
If I know the price is in an advancing stage now…
Then it’s clear that I don’t want to be selling because it’s an uptrend. I’ll either stay on the sidelines in cash or look for buying opportunities. I’m not looking to predict when’s the market going to decline or go into the distribution stage.
If the price is in a distribution stage…
My mindset would be, the market is in a range now after a rally, I’m not sure whether it will breakout higher or breakdown lower.
So if the price hits resistance on the higher timeframe, then if the price is on a distribution stage on the lower timeframe, I might look to sell at resistance since I have this multi-timeframe confluence.
Alternatively, I could wait for the price to breakdown from the support of the range and look for selling opportunities in the declining stage.
Again, you can see that I’m not looking to predict when the distribution stage is going to be over or when the market is going higher or lower. All I can do is to access the current market condition, read the price action, and then find the right trading setup to trade.
I’m not a pro at Elliot Wave Theory, but I believe that Elliot Wave Theory is something along these lines. It describes the market as wave counts, and when it hits the fifth wave, that’s when the market could reverse.
To me, I find that the Elliot Wave Theory is a lot of subjectivity and predicting what the market could do. So to me, it doesn’t really resonate with me. I would rather use the 4 stages of the market to trade as it’s slightly more objective and easier to define.
What is the best timeframe to trade in Forex, and why?
There’s no best timeframe to trade forex. If there’s a best timeframe, then everybody would be trading that timeframe and the opportunities would have been eroded.
It really depends on your trading objective. If you have a full-time job and you want to trade part-time, then you want to trade on the 4-hour timeframe and higher.
If you are a fresh graduate looking to enter proprietary trading, then the best timeframe is the shorter timeframe like the 1-minute, 5-minute timeframes. Because you need to get large enough number of trades for the law of large numbers to work out in a short period of time.
Let’s say you should not risk more than 1% of your trading capital per trade for systematic trend following, if I will be spreading my bets to cover 4 markets, does this mean I need to divide my risk to 4? Meaning each trade has a risk of 0.25%? Or it is fine to allocate a 1% risk for each market?
You’ll allocate 1% risk to each market.
Do you trade currency pairs based on their activity/volume in different sessions (e.g. open and close of London & US markets)?
No, I don’t, because I’m a medium to longer-term trader, and I trade the 4-hour and daily timeframes. So the daily opening and closing sessions are quite irrelevant to me.
However, if you’re a day trader trading off the 5-minutes or 15-minutes timeframe, then yes that would matter to you. Because you want to be trading during the most volatile sessions of the forex market.
The open of the London session is when you want to be trading, especially if you’re trading currencies like the Euro and US dollar.
Do you set your lot size differently for the Forex market?
Yes I do, I position size according to my stop loss, and the pip value of 1 pip. All these are covered in the risk management section of the Ultimate Price Action Trader covering things like risking 1% of capital on each trade, how to calculate your position size for different stop loss.
For Power Stock Trading, will a $10,000 capital work if I am trading US markets? Or can I apply the same strategy to other stocks other than the US?
For Power Stock Trading, you’ll be holding 8 positions. So each position is worth about $1,250. So with USD 10,000, yes it’s possible, especially if you have brokers like Interactive Brokers, with commissions for each trade at around $1 or less.
Yes, you can apply the same trading principles for the other stock markets.
However, I can’t tell you how the annual return and drawdown is going to be like if you follow the exact rules. Because I’ve not done any backtesting on those markets. I’ve only done backtesting on the US markets because that’s the most liquid market which most people can access.
At what time (GMT+8) do you normally analyze and scan the market on the daily timeframe?
For me, I like to do my homework on Fridays and over the weekends. When I produce my market analysis for the upcoming week, it’s usually on Friday morning or afternoon.
I create watchlists on Trading View, according to the types of trading setups that are potentially being formed. And out of those markets in the watchlist, I highlight a few that I want to focus on, for the upcoming week.
How do I use price action give me a better and timely assurance of prices having fallen to a bottom instead of catching a falling knife? Pin bar? Volume? I know we can use trend following method (wait for next higher Low, as a trigger) to identify bottom, but then, the price would have definitely moved higher and possibly the next higher low could occur much later. Thank you.
If you want to time your entry and not catch a falling knife, you could look for a false break setup by using candlestick patterns like the bullish/bearish engulfing candles, hammer, shooting star, etc.
You want to see strong price rejection at support or resistance areas, where the range of those candles are large. This allows you to enter the trade earlier.
Yes, the trend following method of identifying higher lows (or the break of structure technique) might not put you in the trade as early as trading off the price rejection directly. But the benefit is that you can have a tighter stop loss by referencing the previous swing low instead of the lows of the price rejection.
Can you explain leading versus lagging indicators? What are they and how reliable are they?
To be honest, most things that you see on your chart, the candlestick patterns, moving average, RSI, these are all lagging tools, because it has already happened after that fact. The market has to close lower before it tells you that it’s a bearish engulfing pattern.
The market has to go up over the last few candles before the moving average slopes up higher. They’re all lagging, and are based on what has happened especially for indicators, which are mathematically derived from the price.
So what about leading indicators? They are tools like trendlines, trend channels, support or resistance, and Fibonacci extensions. Because when you plot those levels or areas on the chart, it can help you identify future buying and selling pressure.
I won’t use the word reliable, but rather, I’ll consider the objective you’re trying to achieve, and then use those tools to help you achieve those goals.
If you have difficulty defining the trend, then you can use moving average to help you define the trend. You can use the 200MA to help you define the long-term trend. Is it reliable? I won’t say it’s foolproof, but it can help you define a long-term trend.
So don’t just look at how reliable it is, because any tool on its own is unreliable. You use technical tools because you have certain needs or purpose that you want to achieve.
If you want to trail your stop loss, you can use the Chandelier Kroll Stop. Is it reliable? Well, it helps you trail your stop loss, but it doesn’t mean it’ll help you catch a good trend. But if you do it long enough, you’ll eventually catch a trend.
Sometimes market trends are not clear cut; it doesn’t consistently follow higher highs and lows during uptrends, nor do they follow lower highs and lows. Similarly, they don’t always follow the conventional market cycle which you talk about. Is there any indicator that distinctively tells us which cycle market is in?
I agree, sometimes trends are not as clear cut as higher highs and higher lows.
For instance, even in a downtrend, there are bound to be higher highs and higher lows being formed. That’s why you must understand the big picture, don’t just pay attention to the microstructure of the market, because you can be misled easily.
If you have difficulty identifying the trend, you could use a tool like the 200MA to help you identify which direction you should be trading in. If the price is below the 200MA, you’ll look for selling opportunities.
Again, back to the 4 stages of the markets, we are not trying to predict the next stage of the market. What we are trying to do is to identify the current stage of the market and trade in the path of least resistance.
If the market is in a declining stage, I’ll look to sell, that’s it.
If the market is in a distribution stage, it’s in a range, I’ll want to be selling the highs and buying the lows of the range.
Lastly, I do not know of any indicator that tells distinctively which cycle the market is in. If it’s not clear which stage the market is in, then move onto the next market that is clearer. There’s no need to force that market to fit into 1 of the 4 stages.
How to find out the long-term momentum and short-term momentum?
First, let’s define what’s momentum. Momentum measures the change in price over a given period.
A useful indicator is the Rate of Change (ROC) indicator. On the daily timeframe, the 9-period ROC measures the change in price over the last 9 days. For instance, if it’s showing -0.77, it means that the market has dropped by 0.77% over the last 9 days.
If you want to define a shorter-term momentum, you can use a 5-period ROC if you deem that to be short term. If you want to define a longer-term momentum, you can change it to 200-period ROC. That’s one way to define momentum.
Do you recommend using technical indicators combined with price action or should we focus on the price action only?
Yes, you can use trading indicators together with price action trading. Because trading indicators help you summarise historical data.
For example, the Average True Range (ATR) indicator shows you how volatility changes over time. It’s very useful to set your stop loss or trail your stop loss. Personally, I do use indicators with price action trading.
But your analysis and biases should be based on price action. Indicators are just tools to assist you with entries and exits. That’s about it. You have to understand what the indicators are for, but the basis is still understanding the price action of the markets.
What’s the best way to determine a change in trend?
I use the 4 stages of the market to detect a change in trend. When the price breaks out of an accumulation stage, that to me is a change from a downtrend to an uptrend.
Similarly, in a distribution stage, if the price were to break below the area of support (the “last line of defense”), I will change my analysis from a distribution stage to a potential declining stage where I will look for selling opportunities.
So to me, understanding the market structure is the best way to determine a change in trend.
Is the 40-week EMA same as the 200-day EMA?
Yes, they are similar. I won’t say they are exactly the same because one is based on the weekly closing price, while the other is based on the daily closing price.
Which indicator do you use the most often and find the most reliable?
As discussed earlier, I’m not really a fan of the word “reliability” in trading, but rather, it depends on the function of the indicator.
The indicators which I used the most often are the moving averages, the ATR indicator and the Chandelier Kroll Stop (another variation of the ATR indicator).
Can you analyse the AUD/JPY?
I’m looking at the daily timeframe here, where the market is still in a downtrend:
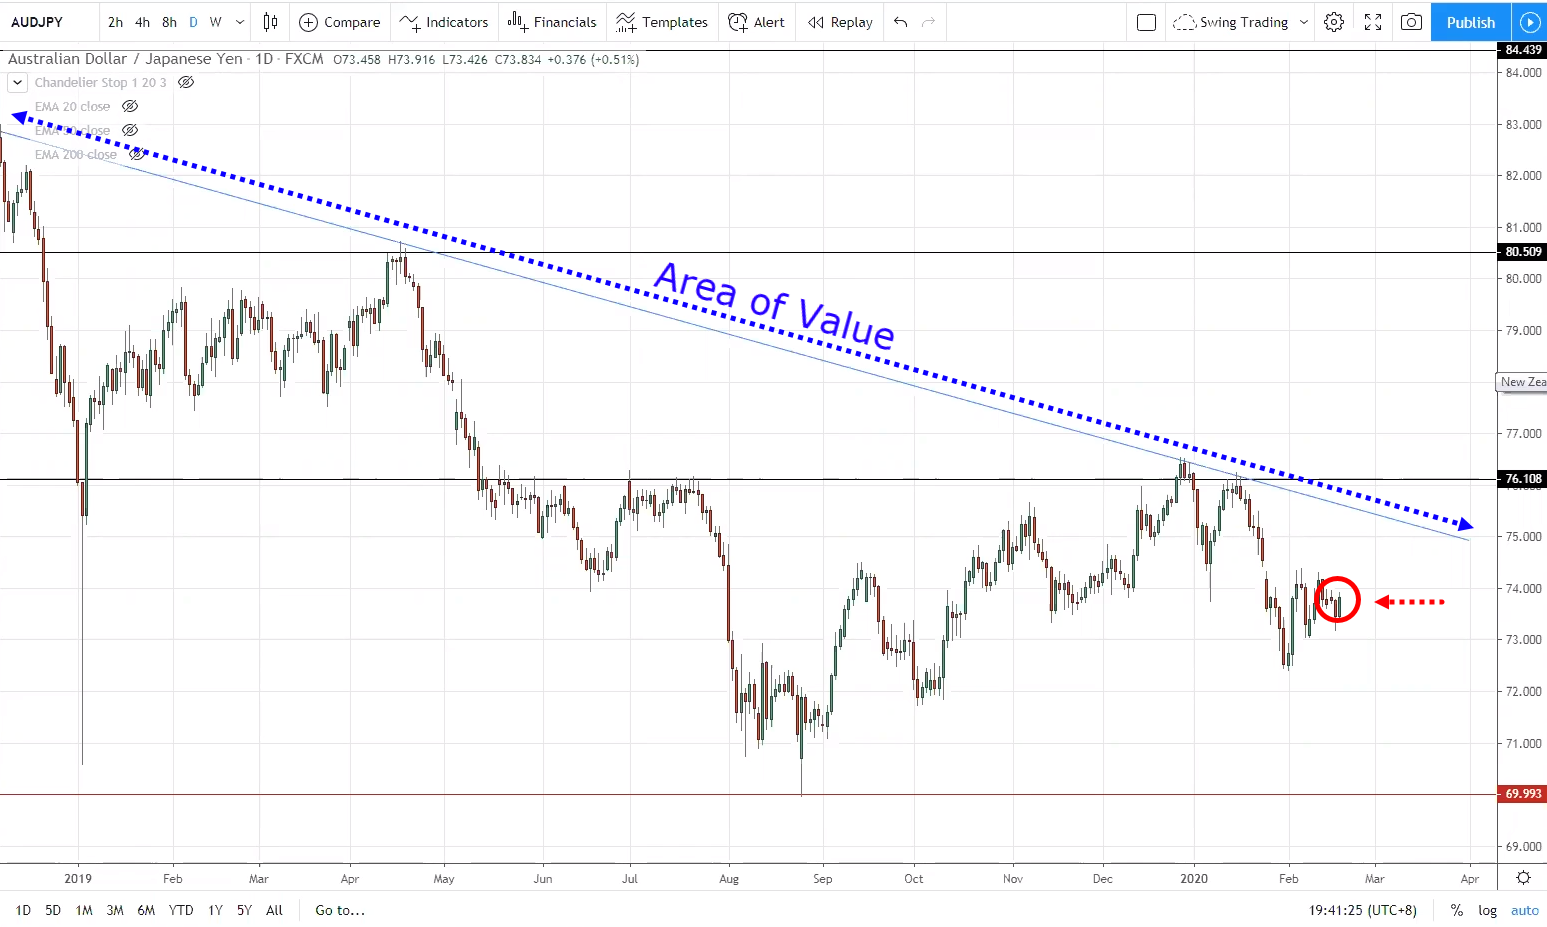
I want to look for selling opportunities. Next, I want to find an area of value which I can trade from. Currently, the price is not quite at an area of value.
If you look at the lower timeframe, the latest price action here could be previous support turned resistance to go short, but the move is so choppy that I would rather stay out of it altogether.
But my bias for this market is towards the downside.
Can you give examples of indicators that we can use for different categories like trend, oscillator, volume?
Yes, I’ve made a video about that, and you can find it over here at the Academy.
Can you give an example of how to do a backtest?
You can check out this article I’ve written over here.
What are the moving averages you use?
I use mostly the 20 MA, 50 MA and the 200 MA. I use the 200 MA to define the long-term trend. 20 MA to define a strong trend and the 50 MA to define a healthy trend.
Sometimes the 20 MA and 50 MA act as an area of value where the price could find support or resistance at these two moving averages.
Do you trade using the Currency Strength Meter?
I do use the Currency Strength Meter to have a gauge of which are the strong and weak markets in the long term and short term. I like to see, for example, the last 15 weeks, which currencies have strengthened or weakened the most.
From there, I also like to look for the short term strong and weak currencies over the last 5 weeks. Then, I’ll try to buy the stronger currency pairs against the weaker currency pairs.
Can the strategies here work for trading Dow Futures?
I believe so because price action will work on any market that is liquid. But you have to understand that if you simply trade off the daily chart of the Dow Futures, you might not have too many trading setups on this one market.
But on an intraday basis, say the 15-minute timeframe, then yes those principles of price action trading can be applied the same.
Do you think scalping strategies work?
Yes, scalping works, it’s a form of trading just like day trading or swing trading. But it’s not suitable for most people because you need to be glued to the screen and you need to have a fast reaction. It’s like a full-time trading career to be a scalper.
For most people, I would say that it’s not too relevant especially if you have a full-time job.
But if you’re a fresh graduate looking to join a proprietary trading firm, then scalping is something that you will likely do.
As a scalper, you have to be fluid. You can’t be just trading one setup like the false break setup. Since you can only devote your time to 1 or 2 markets because the markets move so quickly on the lower timeframe. You got to be versatile and willing to trade false break, breakouts, counter-trend, trend continuation, depending on how the market unfolds.
That’s the true ability of a scalper. They can adapt to different market conditions.
In contrast, a trader on the daily timeframe can be picky and choose to only trade the false break setup and look at many markets to find that setup.
What’s the difference between the Ultimate Price Action Trader (UPAT) and the Ultimate Systems Trader (UST)?
UPAT is all about discretionary trading, price action trading, learning how to use support resistance, trendlines, candlestick patterns where discretion is involved. The way you draw support and resistance is going to be different from another person.
Many traders enjoy the intellectual process of reading the price action of the market to time their entries etc.
On the other hand, there’s another group of traders who doesn’t want to deal with subjectivity. They want to deal with objectivity.
So for instance, if the price breaks above the 50-day high, I go long with a stop loss of 5 ATR. If that happens to be you, then that is what the UST course is all about.
You’ll discover the various trading systems, the logic behind it, the backtest results, the rules, why it works, and the exact system.
If you want to trade without discretion, then UST is something you can look at. If you prefer price action trading and have your own analysis on the market, then UPAT will suit you better.
Those are based on the different trading approaches you prefer, depending on your needs.
How do you define higher highs and lows? Is it based on one or two candles?
I don’t have a fixed definition on defining that, be it one or two candles. Because technically, a higher low or low is made when the price makes a new swing point.
I usually use obvious swing points that stick out to me the most as references. Those are the levels I want to pay attention to the most.