
Download: Video | Transcript
In this video, I'm going to explain to you or share with you this trading system that we have developed called “Follow the Money Trading System”.
You'll understand why we call this later on. Let me explain to you the principles behind it.
First, the market is always changing. It's not just technical analysis where you know that the chart pattern is always changing.
Because from a macroeconomic perspective, the market is also changing as well. The market can be largely broken down into four different categories.
- Economic growth.
- Economic decline.
- Inflation.
- Deflation.
It doesn't go like you know, steps 1-4, It’s kind of like moving around and not necessarily in order.
Economic Growth
The stock market tends to do well when the economy is growing.
Economic Decline
What does well, what doesn't do well?
Clearly, in an economic decline, the stock market isn't going to do well. Most stocks will make a pullback or drop quite a bit during an economic decline.
What does well during an economic decline might be the US Treasury bond where money is flowing towards safer assets, like Bonds and Gold.
Inflation
What assets class do well? Gold and commodities will do well.
I can tell you bonds won’t do well during the high inflation period. Because if inflation is high, the interest rate tends to go up and when the interest rate goes up, bond prices go down, they have a negative correlation.
Deflation
Deflation is a period where prices of goods are not going up, but rather going down over time.
The bond prices tend to do well because when the market is in a period of deflation, it means that the future dollar coming in is going to be worth more than today.
Bond prices will do well because the bond is essentially paying you coupon payments in the future. In essence deflationary period, bond markets do well.
The main thing about this is to share with you the different market environments that we could be in, and the different types of asset classes that could do well and not do well in this different market environment.
Moving on…
Money Flows
As a hedge fund institution, they will move their money according to these different market conditions.
Example
Let's say hedge funds, realize that they're in a bull market, they will allocate more money towards the stock market to create a bull market up higher.
Or when the market is in a high inflationary environment, where will they pack their money?
Well, they pack their money in commodities and Gold. Because those asset classes tend to do well in an inflationary period.
The question is…
How do you quantify this money flow?
This brings us to Momentum
Momentum
In the trading world, we can define Momentum as how much the price moved over a given period.
Momentum also persists in the financial market.
Based on backtesting several asset classes exhibit momentum behavior.
Example
If the price of a certain commodity has gone up in the last 6-12 months, it’s likely to continue higher over the next few months.
Momentum tends to persist in the financial markets and the look-back period is anywhere between 3-12 months.
That's pretty much it.
The core idea of this entire trading system can be summed up to find out where the money is flowing and then follow it.
Download: Video | Transcript
Now moving on let me share with you the exact trading rules of this particular trading system.
Markets Traded:
- S&P 500 (SPY)
- Gold (GLD)
- Commodities (DBC)
- Developed markets excluding the US (VEA)
- US Treasury Bond (TLT)
You can see that these 5 markets are largely uncorrelated. The S&P and the developed markets, they’re correlated to a certain degree.
But the rest are largely uncorrelated and also very liquid.
This is why when the hedge fund institutions put money into these ETFs these markets can trend for quite a while.
There are the five markets that we are focusing on. It doesn’t mean that we are going to buy all five markets, because there’s another rule to it, which is the trend filter.
Trend Filter
The ETF must be above the 200-day moving average. Because we want to go long, we want to buy only when it's trending higher.
If the ETF is in a downtrend, then you know, we want to stay out of it and remain in cash.
That is the trend filter and it must be above the 200-day moving average.
Entry
The entry is simply to buy the top two ETFs that have increased the most in price over the last 6 months.
I'll share with you later how you can do it.
But in other words, we're just trying to find out among the five ETFs I shared with you earlier, which are the two that have exhibited the strongest momentum over the last six months.
Those are the two that we want to buy.
Moving on…
Position Size
We are allocating 50% of our capital to each ETF.
Example
Let's say you have $100,000 trading capital…
You know that this trading system only will buy two ETFs, the strongest one. You can allocate $50,000 to each ETF, $50,000 to Gold and S&P 500 respectively.
Then the $100,000 capital is used up. This is what we mean by position size and 50%/ETF
If your capital is $200,000, then you allocate $100,000 to Gold and S&P 500 respectively.
Moving on…
Frequency
This trading system has very little activity. You just simply trade on the first trading day of the month.
Download: Video | Transcript
NOTE: For updated results, please check the portfolio tracker (updated once a month)
You know the exact trading rules of this system.
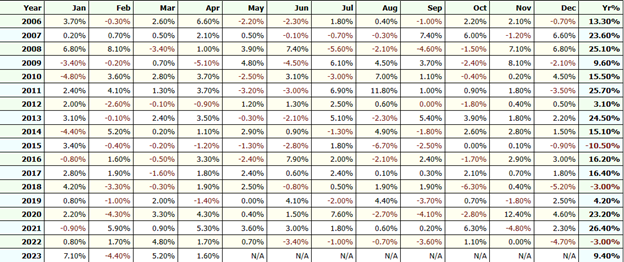
Let's run a back test from 2000-2021 and see how this system has fared over the last 14 years.
You can see over here it has generated about 344 trades:

With an annual return of 13.73%/yr.
Total Gain during the period 588%.
Winning rate 62%.
Average profit percentage 3.85%.
The losing rate is 37.21%.
Average loss over 3.28%:
What is important is that this system has a Max. drawdown of 16.72% over the last 14 years.
You can see that the system is relatively conservative, but you still have losses along the way.
Equity Curve

Going higher over the last 10-plus years. This signal to us that this has an edge in the markets.
You can see over here, in 2007 it went up 23.3% and in 2021 it went up 26.5%:


A losing year in 2018 as well:

I'm doing this video in 2022 in early July. As of now, based on the numbers I'm seeing in this system, it’s still up the year.
It's up about 7% for the year.
That's the result of this trading system.
Download: Video | Transcript
I want to talk about how to trade this system because it’s so easy, you don't even need a scanner whatsoever.
I'm going to walk you through step by step guide on how you can go about trading this monthly ETF trading system called "Follow the Money".
How to Trade The System
- On the first trading day of the month, Identify the ETFs which are above the 200-day MA.
- Rank the ETFs according to their Rate of Change (ROC) over the last 6 months.
- Buy the top ETFs.
Example
S&P 500 Daily:

What I do is just put all these ETFs on a watch list. Today being the 6th of July 2022, which ETF do we need to buy?
Just do a quick one and call out your 200- day moving average.
Lets start with the S&P 500
S&P 500 Daily:

You realize that the price is below the 200-day moving average. This means we don’t need to bother with it.
GOLD Trust Daily:

The price is below the 200-day moving average. We move unto the next one.:
VEA Daily:

The price is below the 200-day moving average:
DBC Daily:

The price is above the 200-day moving average:
Clearly, the only one that we need to buy is the DBC. You can use a spreadsheet to make your life easier:

From the spreadsheet clearly, you know that the only one you need to buy is the BDC.
Assuming that today's the first trading day of the month. For completion’s sake let’s measure the ROC for learning purposes.
The way to do it, you go to your monthly timeframe.
To identify the ROC, you just pull out the Rate of Change indicator, change the settings to 6.

Because we are looking at the last 6 months. Today is the 6th of July 2022.
Where should I place my cursor line on the Trading view chart?

You place your cursor on the chart to the month of June 2022.
Since we are dealing with the monthly chart, a candle represents the 1st-30th of June 2022. At this point, you can see that the rate of change is -20.57.
How do I know that?
Just pay attention to this.
What I’m going to do is go to my spreadsheet and fill the ROC column for the SPY to the value of -20.57:

You do this for all the listed ETFs:

From the spreadsheet information, I know that the only ETF that I need to buy is the DBC
The question is…
How much DBC do I need to buy?
Example
I have $100,000 capital. Do I buy all $100,000 in DBC or just $50,000?
We just buy $50,000 worth of DBC. Remember each position size is 50% of our capital. Even though we only have a chance to just buy one ETF we still follow that 50% position size.
We will buy DBC with a 50% position size.
The exact dollar amount to buy? I'll go through that calculation part later, but for now, I just want to teach you how to do this ranking system right on your own.
How Do I Know Which ETFs to Buy?
This is what I'll do. I’ll put the last trading day of June 2019 which is 28th June and see whether the S&P is above the 200-day moving average for the SPY:

Yes, it is!
What I'll do is I'll go to the spreadsheet and put “Above” in the 200-day moving average column:

Then do the same for the other ETFs:

From the spreadsheet, you can see that there are three ETFs above the 200-day moving average.
The SPY, VEA and DBC.
Now the question is among this three which should we buy?
This is where we use our Momentum or Rate of change to find out which ETFs have performed the best over the last 6 months.
You can do this by going to the Monthly timeframe and looking for June 2019 candle since we are getting ready for July 2019:

The Rate of change the value is 17.24:

Tip
This is very important.
You must ignore the current month when looking for the Rate of change and have it show the previous month. Doing otherwise would be wrong because we are looking back at the last 6 months.
This is just for it to be accurate.
Remember you are doing this on the first day of the month and going back to the last day of the previous month to determine the ROC.
Do it for all the ETFs that are above the 200-day moving average like the VEA and DBC.

Which ETF Should we buy?
Pretty straightforward, we look to buy the SPY and the VEA. Because these two are the top performing ones in terms of their Rate of Change over the last 6 months.
That is how you go about identifying which ETF to buy on a particular month.
This is the way it should be done.
Download: Video | Transcript
I just want to spend a few minutes explaining how to use the TradingView for those of you who are not familiar with it.
If you're already a pro at TradingView, you can skip this video. If not, then I'll just run through this quickly.
If you want to create a new watch list, just go here:

Then give it a name:

Click "Save".
This it the watchlist created:

If you need to edit the five tickers I shared with you, then click “+”:

Type GLD and press enter:

Type SPY and press enter:

Type VEA and press enter:

And it starts populating up over here:

How To Add An Indicator
Moving Average
If you want to add an indicator, Go to Indicator Tab:

Search for “Moving Average":

Just change the length to "200":

Let's say for those of you who are feminine, you can choose pink:


There you have it. What about Rate of Change?
Rate Of Change
Serach for "Rate of Change":

Using the 6-period ROC since we are considering 6 months back:

Then Click “Ok”
Remember, again.
Let's say, for example, this is the first trading day of October, which candle on the chart should be at the right-hand end showing?
The right-hand end of the chart should be September. Because that candle has already closed.
You want to push it all the way until the September candle is at that right-hand end of the chart then you reference the rate of change value from that.
This is so important.
Let’s move on.
Download: Video | Transcript
How do you calculate your position size?
Super easy!
I'm going to give you a formula that even a 10-year-old can understand.
Capital
What's the capital that you're going to allocate to trade this trading system?
Is it going to be $50,000, $10,000, $100,000? You must define an amount you want to allocate to this trading system.
Because you never know how this system might affect your own mental trading psychology in the live market.
Always reduce the size and start small. If you're comfortable can always scale up later on.
Capital is the amount allocated for the trading system.
Dollar ETF
$ETF is basically the amount of money allocated to each ETF. As you know we buy a maximum of two ETFs.
$ETF = Capital/2
Example
Assuming you have a starting capital of $20,000.
We divide the $20,000 by 2.
You can buy up to $10,000 worth of each ETF.
That will do your position size, or the number of ETFs to buy, which equals your position size equals your $ETF divided by the closing price.
Position size= $ETF / Closing Price
Example
DBC is the only ticker that meets the requirements that we need to buy.
It doesn’t mean that we allocate all 100% of our capital to that ETF. We still stick to the 50% rule and stay 50% in cash.
Let's find out what's the recent closing price of DBC.
Right now, is July 2022 so we go back to the last trading day of June closing price to determine the ROC.

My closing price for the end of June is $26.64. How many units or how many shares of DBC do we buy?
Let's say for example, with a capital of $20,000. This means that for each ETF we can spend no more than $10,000 on it.
The closing price of DBC at $26.64.
$10,000 divided by 26.6 = 375 shares or units of DBC that I can buy for this month.
$10,000 / 26.64 = 375 Shares.
And that's it, I'm done for the month. That's pretty much it.
This is the entire “Follow The Money Trading System” in a nutshell.
I wish you goodluck and good trading.
I will talk to you soon.
Download: Video | Transcript
How to Use Leverage and Boost Your Returns
This is the result of the Follow the Money Trading System over the last 17+ years;
The reason why is 17+ is because right now, it’s 2023.
I have the latest data until April 2023:
![]()
Currently, we’re up 9.4%:
For annual return is about 13% a year:
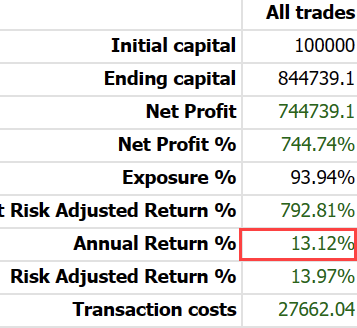
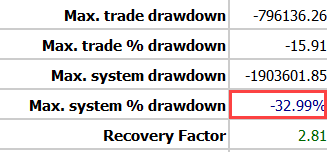
With a maximum drawdown of 16% as you can see over here:
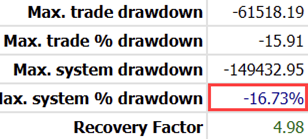
The maximum drawdown is an important figure to understand.
Because this tells you how much you would have lost at a maximum If you have traded this system over the last 17 years.
Example
Let’s say you have a maximum drawdown of 16% and this tells you that over the last 17+ years, while you’re trading this system, you had a maximum loss at one point.
Your account was down 16% from the highs.
Your account, the equity curve high at that point is about $100,000.
If you have a 16% draw down from $100,000 means you could have expected your account to be deep down to $84,000 at one point.
This is what we mean by a 16% drawdown.
16% of $100,000 is $16,000.
$100,000 – $16,000, = $84,000.
This is what we mean by maximum drawdown.
Of course, if you have a maximum drawdown of 50% it means that at one point, you lost half your money.
This is important.
This trading system, now what I’m showing you over here is without leverage and no return of 13% a year:
Now if you go with the leverage, let’s say 2x leverage, the number would change.
You can see with the leverage; these are the new figures over here:
You see that now your annual returns just simply multiply by 2, 26% a year:
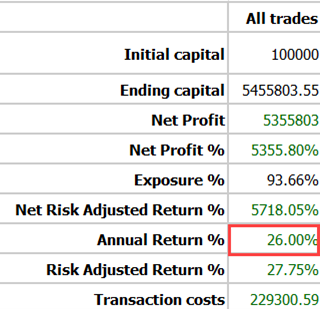
On average, your maximum drawdown is also double:
One important thing to understand is that when you use the leverage, your returns will naturally increase.
At the same time, your maximum drawdown definitely will increase along as well.
If you use leverage on just one system, the risk and return will go up accordingly.
If you look at the results, it’s just double.
How to Leverage and Boost Your Returns
Don’t use leverage at the start
Because different traders, all have different tolerance for risk.
16% may be nothing to you but to other traders 16% drawdown maybe
“It’s a lot man Rayner! I can’t take it!”.
If you can’t take 16% and you go to use leverage, it’s going to get worse.
Don’t use leverage at the start, understand the drawdowns, and experience it yourself. So, you know your risk tolerance, this is something that is going to be different from trader to trader.
When ready, start with 1.2x leverage
Once you’re comfortable with the system, then you can try maybe 1.2x times leverage at the start.
How do you do that?
It’s very simple.
Example:
You are trading the system and let’s say without leverage…
After calculating your position size, for example, you need to buy 100 shares or 100 units of gold.
This is without leverage.
And of course, if you were to use leverage, it’s 100 x 1.2x
Instead of buying 100, you buy 120 units of gold.
This is how we use the leverage we buy, in this case, 20% extra.
Once you are comfortable with 1.2x leverage, you understand the drawdown naturally, your drawdown will increase by about 20% and if you’re comfortable with it, then you can slowly scale up to 1.5x leverage.
The way to calculate a 1.5x leverage is the same.
If you’re still very comfortable with 1.5x leverage, and you have to bear in mind at this point,
Your maximum drawdown will be even higher than 16% possibly in the realm of close to 30% or 30+%.
If you’re still okay with it and you want to push things further, you can go up 2x leverage
But I don’t recommend this for most people because one thing to understand about leverage is that your biggest drawdown, it’s always in the future.
Never in the past.
Example:
Based on our testing, the maximum historical drawdown without leverage is about 16% a year.
But you shouldn’t tell yourself that.
“Oh. the maximum drawdown I’m going to get for the next 30-40 years is 16%.”
No…
You should probably expect 20-25% or maybe who knows or even 30%.
Because your maximum drawdown is always in the future.
Always bear this in mind.
If you’re going to go down with the leverage, you have to consider that.
Example:
The maximum drawdown in the future could be up to 25%.
If you are going with 2x leverage, you might potentially encounter a maximum loss of 50% sometime in the future.
Again, leverage is a double-edged sword
This is why I recommend at the start, don’t use it.
Trade without leverage, then you slowly scale up and find your comfort level after you have been trading this system for a while.
Another final thing to point out is that when you use the leverage, you will encounter a financing charge.
It depends on the interest rate environment that you’re in.
I won’t be surprised that your broker charges spread, you probably have to pay like 6% a year for financing charges to use leverage.
So, 6%…
Is this something worth paying for?
In my opinion, I don’t think I will use leverage if I have to pay like 6% a year.
Because who knows? let’s say for this particular year, the system is down for 10%.
10% that’s not all because if you still have to pay that 6% interest financing charge that you incur that year, you might be total down of 16%.
Again, you have to find a spot that you’re comfortable with.
How much interest expense you’re willing to pay?
For me, I think anywhere between 2 and 3% I can still pay.
But anything above that like 5, 6, 7%, I’m not going to pay the interest charges and I probably don’t want to use leverage.
Because I will incur this pretty huge expense.
This is another thing to take note of as well.
With that said, I have come to the end of this video and I’ll see you in the next.
Download: Video | Transcript
Hey, hey, what’s up my friend?
I’m excited to share with you that an updated and improved version of the Follow the Money, A.K.A “FTM trading system” is available.
To walk you through, what this is about?
The SPY
If you look at this, these are the original rules of the Follow the Money Trading System.
This is the result from 2016-2024

You can see the equity curve over here.

Then you are going to look at the figures about 11% over the last 9 years.

Maximum drawdown of about 16 %.
You might be wondering — “Rayner why you don’t run from 2016 to 2024?”
The reason will be apparent in a short while.
The SPMO
This SPMO is the improved version.
You can see the equity curve.

The yearly results every single year, we are in green. It’s pretty much a banger year with a 34.70%

Whereas the SPY version is up 24% with a couple of losing years in between.
You can see that the improved version is much better if you ask me.
The annual returns since 2016 are about 14%.

The maximum drawdown is about 14%.
You can see that we have increased our annual return and reduced our maximum drawdown.
Now…
What’s the secret?
What is the change to this trading system?
It’s a small change only.
Let me tell you what the change is…
The change is Instead of trading SPY as our ETF, we are going to replace it with SPMO.
You might be wondering…
“Rayner, what is SPMO?”
What is SPMO and how does it work?
If you look at Google/yahoo search…
“The funds generally will invest at least 90% of its total assets in the securities that comprise the underlying index. The underlying index is designed to measure the performance of approximately 100 stocks in the S&P 500® Index that have the highest “momentum score.”
What this fund does is that it invests in stocks that exhibit signs of momentum.
It’s a kind of momentum trading fund if you want to call it that.
So, it pretty much buys stocks that have shown signs of strength recently.
Holdings

Right now, some of the holdings it’s like 10% of the ETF are assigned to Amazon, almost 10% to NVIDIA, and then META about 6%, all the way down.
Looking at the different sectors now, it’s kind of overweighed in the financial services, Technology, and consumer cyclical.

Not so much in utilities, real estate, and basic materials because these sectors, or rather the stocks in these sectors are quite weak.
Probably not in an uptrend, probably, in the downtrend, ranging or whatsoever.
This one pretty much just puts…
I would say — It’s money in stocks that have exhibited signs of strength, assigning a momentum score to each stock.
Then those stocks that have a stronger performance, better performance, stronger momentum, they’ll put more money into the stocks as you can see over here:
The top 10 stocks and top 10 holdings make up about 56% of its total assets.
Moving on…
How has the SPMO performed over the SPY over time

There are three lines over here:
But just pay attention to the S&P index, the one in light blue, and then the S&P Momentum ETF.

Because this is the one that we want to buy, the SPMO.
If you look at the S&P 500, the one in blue, and then the ETF which is the dark blue line:
You can see that they are correlated.
When the overall market goes down, guess what?
This ETF also goes down over time through drawdowns.
But where it’s apparent is that usually when you see the drawdown,
This ETF, the drawdown based at least on the last few years, is shallower compared to the SPY and S&P.
Let’s say the SPY has a drawdown of 50%.
This fund probably will be around 45-46 % drawdown.
The draw is not as deep. It’s still going to be deep, but not quite as deep as the S&P500.
When the market rebounds higher, the fund tends to be higher as well.
You can see there’s a light blue line when the S&P 500 rebound higher, this fund rebound up higher even more.
From a risk-adjusted return, this ETF has performed better than the S&P 500 over the last few years.
This is because instead of buying every stock out there, it focused mainly on stocks that have exhibited signs of momentum, signs of strength, and it’s a proven factor in the market.
Momentum is one of the factors or it’s one of the strategies that has proven to work over the last few decades even till today.
That’s why we have systems like the Trend Following System, and MOMO stock trading system for those of you in the Ultimate Systems Trader program, you may be familiar with all these systems.
We are taking advantage of or exploiting this momentum effect, this factor if you want to call it.
People in the academic world call this factor.
There’s a momentum factor, there’s a value factor, a small size factor even, etc.
But momentum is, I would say the top of the list.
The one that has been perceived for the longest time.
If you ask me, the reason is largely because of psychology.
When people see the market going up higher, they may think, it’s not logical to buy at this height, but you know, FOMO.
This is why they buy and push the price even higher, that’s why there’s this momentum effect in the market.
Back to where I was at.
You understand what the SPMO ETF is about.
You’ve seen the price performance compared to the S&P 500.
How can you implement this in your trading for the FTM trading system?
Well, it’s very simple.
What you’re going to do now, so it’s basically, you know which are the ETFs that you’re trading.
The first version, we have…

- SPY
- GLD
- VEA
- TLT
- TBC
What we’re going to do now is we’re going to remove SPY because it’s going to be replaced by SPMO.

Then everything else remains the same.
Every month, you calculate your ROC (rate of change), and you calculate these 5 ETFs.
SPMO has now replaced the S&P 500.
That’s pretty much it.
This one change will be likely to improve your risk-adjusted returns over time.
Just making this one small change.
To answer back the earlier question, why do we start from 2016?
Very Simple.
If you look at SPMO, this ETF started back in 2016

This is why as much as I wish to go back to 2008, we just don’t have the data available.
Looking at the last 9 years of data taking into account the COVID, Russia, and Ukraine war, low inflation, and high inflation period, this seems to be holding up pretty well.
This is why I’m confident that…
“Hey, trading the SPMO instead of the SPY would yield better risk-adjusted returns moving forward”

If I just compare this with the spy you’ve seen this earlier, but I think maybe now it’s a bit clearer.
You can see this is the returns of the S&P 500.
Since S&P 500 is the one in red then the SPMO is the candlestick chart.
You can see that whenever there’s a drawdown.

It both goes down together.
Sometimes the drawdown might be of a similar magnitude, but where it really shines is that when the market takes off, the SPMO usually will take off much higher compared to a buy-and-hold on the S&P 500.
Hopefully, this makes sense, right?
Go out there.
Beat the markets, generate extra income, and grow your wealth.
I wish you all the best.
Good luck, good trading…
I will talk to you soon.
When do we sell the ETF?
On the first trading day of the month, do your scan.
- If it’s no longer in the top 2 rankings, sell it and replace it with the higher ranking one.
- If the ETF is below the 200-day moving average, sell it.
Is there a stop loss for this system?
There’s no stop loss. But there are exit rules as explained earlier.
If I have two positions and one ETF position gained some profits, should I rebalance it in the next month?
Yes, you would rebalance them 50-50 for each month.
Can I use leverage for this system?
Yes, you can.
I recommend not more than 50% leverage to keep the drawdown manageable.
Why is the maximum trade only two? What happens if I trade more or less than that, will my returns decrease?
Your returns may not decrease but your risk is likely to increase.
Can I use CMC Markets to trade this system?
I don’t recommend CMC.
Instead, go with a broker that allows you to trade ETFs using cash so you don’t have to incur unnecessary transaction costs.
If I were to add funds every month to this system, should I add more positions to my existing ones? Or wait for the next entry?
It would be easier to wait for your next entry and then allocate 50% of your capital to each position.