You have said to use a position size calculator on all trades, does that includes 5-minute/ 15-minute/1-hour/4-hour/daily timeframe?
If you can do the math and don’t wish to use the calculator, feel free to do that. But it makes your life easier if you could use a position size calculator.
Market maker brokers like CMC or Oanda have in-built position size calculator, where you can put your entry and stop loss, and you can manipulate the position size to your desired risk level.
I always trade on the higher timeframe, but after a trade is entered, can I trade in the lower timeframe to take profits or losses?
Higher timeframe and lower timeframe are kind of subjective because your higher timeframe might be someone else’s lower timeframe.
The general guideline is this, if you enter your trade on the 4-hour timeframe, then you want to manage your trades on the 4-hour timeframe.
You don’t want to go down to 1-hour or 15-minute timeframe to manage your trades. Because your trade is based on the 4-hour timeframe.
So whichever timeframe you based your setup on, that’s the timeframe you want to manage your trade on.
On MT4 platform can you trade stocks/futures?
I’m not very familiar with it, but it’s probably for CFDs. I don’t think it will be directly routed to the stock exchange. I don’t think you can trade futures as well.
Where can I get the Chandelier indicators, and how to install it in MT4?
I primarily use Trading View, so I don’t have an idea on this one. Google will be your best friend for this question.
I lately found myself as a discretionary short-term swing trader. I mostly trade breakouts and pullbacks. I also know trading is not an overnight get-rich-quick scheme but a game of patience, probability, and risk management. Is there any more to learn so that I can be more successful in my trading (as my goal is also to make 50% of my living as a trader)?
The thing about trading is that it’s not about acquiring more knowledge to become profitable. It’s about mastering a specific trading methodology, mastering a certain setup and make it work for you, especially coming from a discretionary standpoint.
If you’re focusing pullbacks and breakouts, then master these types of trading setups. When you’re good at it, you can trade across different timeframes and more markets. That’s how you find more profitable trading opportunities.
I suggest journaling down your trades, identifying your pullback and breakout trades, find out which ones make you money.
Yes, you can adopt different trading methodologies like trend following and systematic trading. But again, from a discretionary standpoint, my take is to master those few setups and learn to trade it across more markets.
I mostly trade the US and Australian stock market. I am confused when are the times to stay out of the market even though I find the setups that I often trade.
It’s hard for me to say when are the times to trade because it depends on your trading style if you’re a day trader or a longer-term trader.
Because if you’re a day trader, you’ll want to focus on the opening and closing session when the volatility is higher.
If you’re a longer-term trader, trading on the daily or weekly timeframe, then there’s no reason to stay out of the market as long as your trading setup presents itself.
So I can’t really give the right answer here without knowing the type of trader you are.
Do you believe the performance of industry affects the stocks under that industry? Will it be a good idea to trade according to industries momentum?
Yes, I do believe that if a sector is strong, and if a stock is in that sector, then the rising tide will lift all boats. The stock will be affected by the sector, it floats up with the sector if the sector is doing well.
In the stock market, it pays to focus on the strongest stocks out there, like those which have moved the most over the last 6 or 12 months. These will outperform the market.
For example, Amazon and Tesla are strong stocks that have moved the most in price over the last 50 weeks. Even now, they’re still the leaders of the market. If the market goes up 1%, these stocks will go up maybe 1.5%.
So yes, follow the leaders in the stock market.
Do you believe that a discretionary trader can be successful in the long run?
Definitely. But discretionary trading is not for everyone. If it fits you, definitely you can find success in it. George Soros and Paul Tudor Jones are famous macro-traders, they are mostly discretionary in nature.
There are also systems traders who find success out there as well. It depends on what suits you best and then going all in, in that trading approach.
For beginners looking to trade in forex, Would you recommend them to focus on 1) one currency pair, 2) a few currency pairs 3) trade whatever strong-weak, weak-weak, strong-strong currency combinations that might change weekly based on the weekly Currency Strength Meter?
Without context, I can’t really give the right answer for this. But if you’re a beginner, and you’re trying to be a day trader, then it makes sense to focus on only a few currency pairs. Because for day trading, you can’t be watching 30, 40 currency pairs, it’s not possible.
But if you’re a longer-term trader, trading the 4-hour, daily or weekly timeframe, then yes you can take a look at more currency pairs for more trading opportunities.
I don’t recommend looking for strong-strong or weak-weak combination using the Currency Strength Meter. How I use it is, more of getting a feel of which currencies are strong or weak in the long run and short run. I don’t use it to find the best currency combination.
Ultimately, it’s the trading set up that comes along with it, if it’s a valid trading setup or not. Then if I can pair a strong currency with a weak one, then I could look to ride the trend. If that’s a medium-medium currency pair, then I’ll look to capture one swing in that market.
For me, the Currency Strength Meter is just to get a feel of what’s strong or weak in the long run and short run.
How do you know when the trend has reached its exhaustion zone and it's ready for sideways action or market reversal?
For example, if the trend has been going up and respecting the 50 MA, but it starts to break the 50 MA and is no longer respecting it, then it signals to me that the dynamics of this market is changing.
This tells me that this market could go into a sideways action for a while. Whether it breaks out higher or down lower is anyone’s guess. But if it breaks out higher, then my bullish bias remains. If it breaks down lower, then that’s where I will take a bearish bias and possibly hold onto cash.
If a key zone or a key moving average that was previously respected gets invalidated, that’s usually the signal that this trend is having difficulty heading higher. Doesn’t mean it will reverse, but maybe it will need some time to pause before making the next move higher.
You mentioned a lot about having an edge, what defines an edge? For e.g. Price comes to a major area of support with a clean move and does a false break and reverse back up higher, and suppose if I trade that same setup over and over again and get success is that an edge? And many more trading strategies that you teach do they have an overall edge? Can someone's edge work for someone else? Or it's just a matter of consistency?
An edge for a discretionary trader can be split into 2 parts. A hard edge and soft edge. A hard edge is about the setup itself, does it give you a statistical advantage in the market?
When it comes to price action trading, there’s an element of subjectivity, because one person might think it’s a valid setup whereas another person might not. It’s only through your trading journal, that you know whether that trading setup works for you or not.
The soft edge is your psychology and discipline, whether you have the ability to adhere to your rules.
Yes, many trading strategies that I have taught have an overall edge, if not I would not be teaching them. But again, just because it has worked for me doesn’t mean it will work with all traders.
Some of them might not be comfortable trading the setup. Some of them, if I tell them to trade trend continuation, they might feel the price is too high and can’t bear to buy or pull the trigger.
Coming from a price action perspective, you got to take the concepts that I teach and tweak it and make it your own.
Someone’s edge can work for someone else, they can find similar success with it, but at the same time, they can take the same strategy and concept and find no success with it.
Price action trading is one way to trade the markets, and there’s this element of subjectivity that some traders cannot handle. They might want something quantitative. If that’s the case, they might want quantitative trading with no subjectivity, and just let the edge play out.
How profitable is your price action method and how’s your account growth like?
How profitable your trading method is, depends on a few factors:
- The timeframe you’re trading on
- Amount of risk you put on each trade
- Account size
- Number of markets traded
So it generally depends.
I have a trader, who has been one of my earliest students, been with me since 2015 or 2016. Recently I spoke with him, and he told me that he has been consistently profitable over the last few years. So, clearly, price action trading methodology has worked for him.
Then there’s another guy, CEO of Investagram, he’s not a student of UPAT, but he reads my blog and tells me that he follows similar trading strategies as I do and trade in a similar manner. He trades the Philippines stock markets. From what I last heard, he does about mid to high double-digit returns each year in the Philippines stock markets.
And of course, there are students who take my course but don’t find success with it.
Really, there are too many variables here to say how profitable the price action method is.
As for my account growth, to be honest, in my earlier years of trading, I had triple-digit account growth. But it wasn’t because I was a better trader back then, but it was because I was risking a higher percentage of my account per trade.
Over the years, my returns have mellowed down, and if I get 10% to 15% a year, I’m happy with it. It’s not because the trading strategies have stopped working, but to me, now price action trading is just one strategy that I use in my portfolio because I also use systematic trading.
There are many variables at play here and I wished I could give a definite answer, but it’s not possible in the realm of discretionary trading.
If you want something more definite, then you might want to look at quantitative trading where you can do backtest on a fixed number of markets, with a fixed risk, a fixed account size, so you can breakdown the numbers on a month on month basis. That will give you a good idea of how profitable a trading strategy is because there is no discretion.
Hi Rayner, I have finished developing and testing a trading plan and am so excited. The problem is I keep missing trades that meet my setup. How do you avoid this?
Every week, I publish market analysis on the potential setups that I’m going to trade for the week. I will list down possible trend continuation trades or breakout trades etc.
I also go to my Trading View platform and create a watchlist, and bookmark in red those few markets I want to focus on.
Some of you might be working, so what you can do is set alerts on Trading View or MT4 and get notified when the price has hit the level that you’re watching.
I read about the concept of demand and supply zone trading. Is that similar or different to your teaching on price action trading?
I have read about supply and demand, but I find it very similar to support and resistance. I find that support and resistance, there’s no need for me to incorporate supply and demand because they are so similar.
It’s like me using a 50 EMA, while another trade is using the 50 SMA, I just need to use one of them because they are so similar.
Again, I could be wrong, because I haven’t dived deep into supply and demand, and I have not really taken much of that into consideration.
For forex, many pairs correlate, some strongly, some non-related and some weakly correlated. How do you go about managing trading multiple pairs when some of them are strongly related? For instance, if you spot 10 trade setups, do you just choose to say like 5 and forgo the rest (assuming they're correlated)?
So for example, this week we have several correlated pairs like the Aussie pairs.
From a discretionary standpoint, I will not want to take more than two setups of a similar currency pair. So if I took a trade on AUD/JPY and AUD/USD, I would not take another Aussie pair.
Another way to go about it is if you want to take more pairs and you usually risk about 1% on each trade. If you have 3 setups, you can take all 3 but risk 0.5% of your trade each instead. So in total, you will be risking 1.5% to the Aussie pairs.
What do you think about Quasimodo setup fail became diamond?
To be honest, I don’t know about this so I can’t comment on this one.
Hey, Rayner let say the price is in a downtrend respecting 50MA, I saw most of them you willingly short when the price break below the previous swing low. Why you don't just short when there is the price rejection at 50MA? (I think you willingly do this when it is the mean-reverting market because you try to find false break setup near previous swing high).
Usually, if the price comes nicely into the 50 MA, and gets a nice price rejection, I have no issues selling at that area as well, especially if the 50 MA also coincides with the previous swing high.
Do you give more weightage to the 15-week ROC or 5-week ROC Currency Strength Meter, as sometimes the currencies do not line up?
Yes, you’re right, quite often, they will not line up. For me, the one that you should give more weightage to depends on your trading timeframe.
If you trade the lower timeframe, like the 1-hour or 4-hour timeframe, I would say the 5-week ROC would matter more to you. If you trade the higher timeframe like daily or week timeframe, I would say the 15-week ROC matters more to you.
Mainly, I use this as a feel for the market. If according to the 15-week ROC, the Aussie is the weakest, while the 5-week ROC shows Aussie being on top, and you might wonder what’s going on.
What it’s telling you is that, over the past 5 weeks, Aussie is probably having a pullback, that’s why it’s staging such a strong rally and the 5-week ROC is strong. But overall in the big picture, the last 15 weeks’ ROC for Aussie is still the weakest.
For this kind of condition, I will look for the retracement to end before going short, in line with the 15-week ROC.
This is how I use the Currency Strength Meter, to really have a feel of the different currency pairs out there. To me, this is secondary.
What matters most is:
- The trend
- Trading from an area of value
If the Currency Strength Meter complicates your trading, then just take a step back and go back to fundamentals. The trend really comes first.
Does price action trading ignore the fundamental aspect of a stock? For instance, Hertz (a company that is going bankrupt) is being traded heavily by some of the retail investors. If the price action trend of Hertz matches a strategy, will you execute the trade or will you avoid because the company is junk?
I’m a believer that the price leads the news. I’ve not looked at the shares of Hertz, so I’ll look at it now.
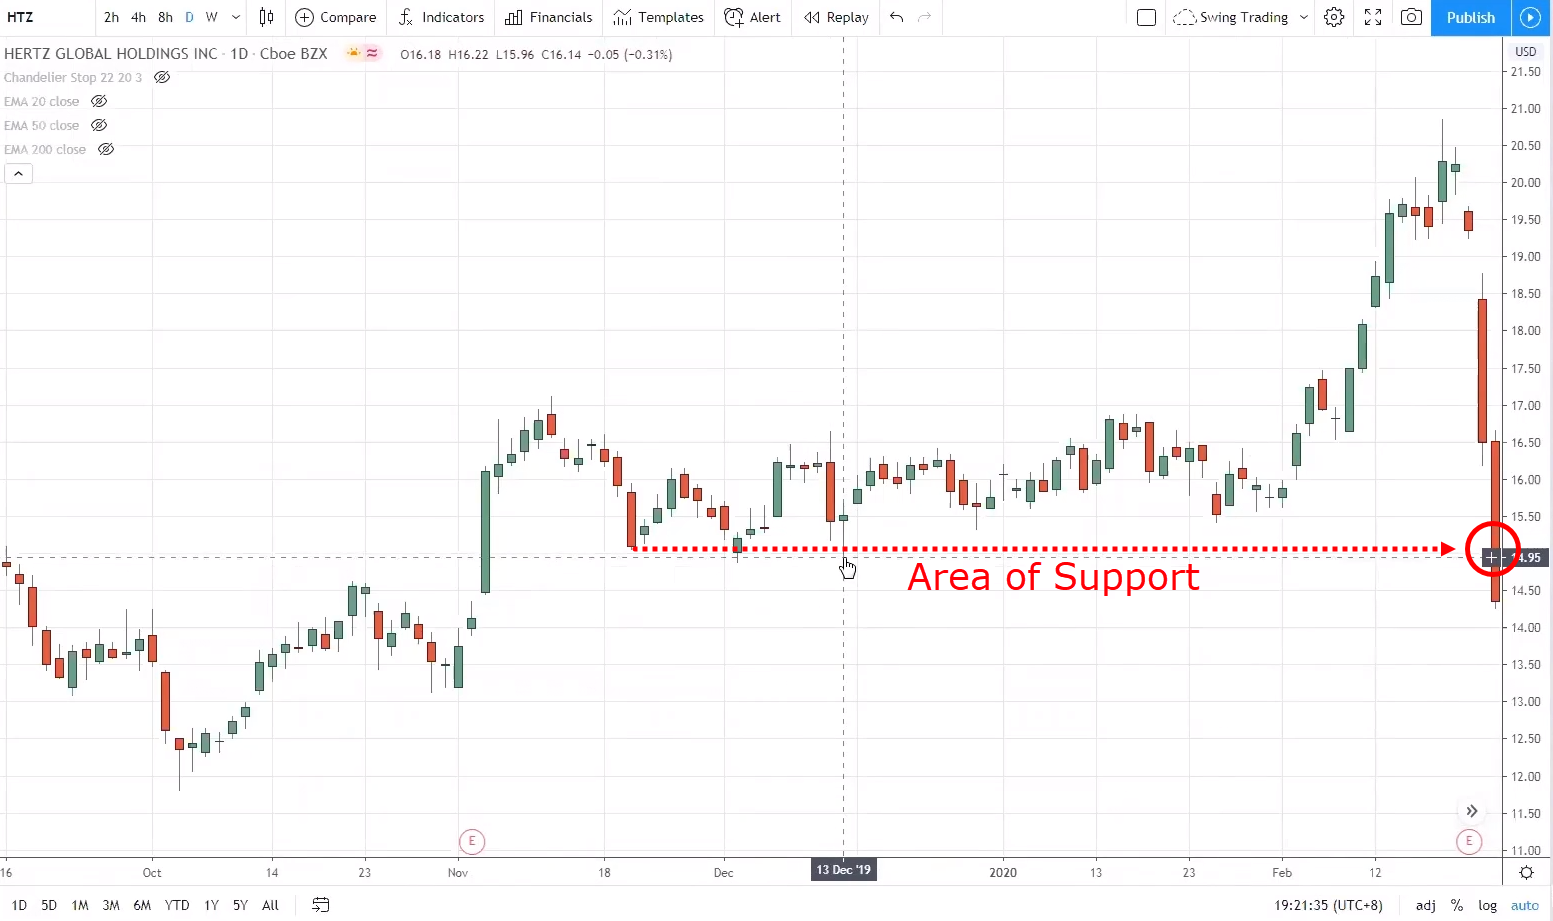
Let’s look back in time and assume that Hertz was one of the strongest stocks out there and I want to buy at that point.
At that $14.95 area of support is where I will look for a potential false break of that level. But that didn’t happen and instead, the market gapped down lower. So I’ll stay out and re-evaluate.
I’ll stay on the sidelines because the price has broken below the area of support and there’s no reason to be buying.
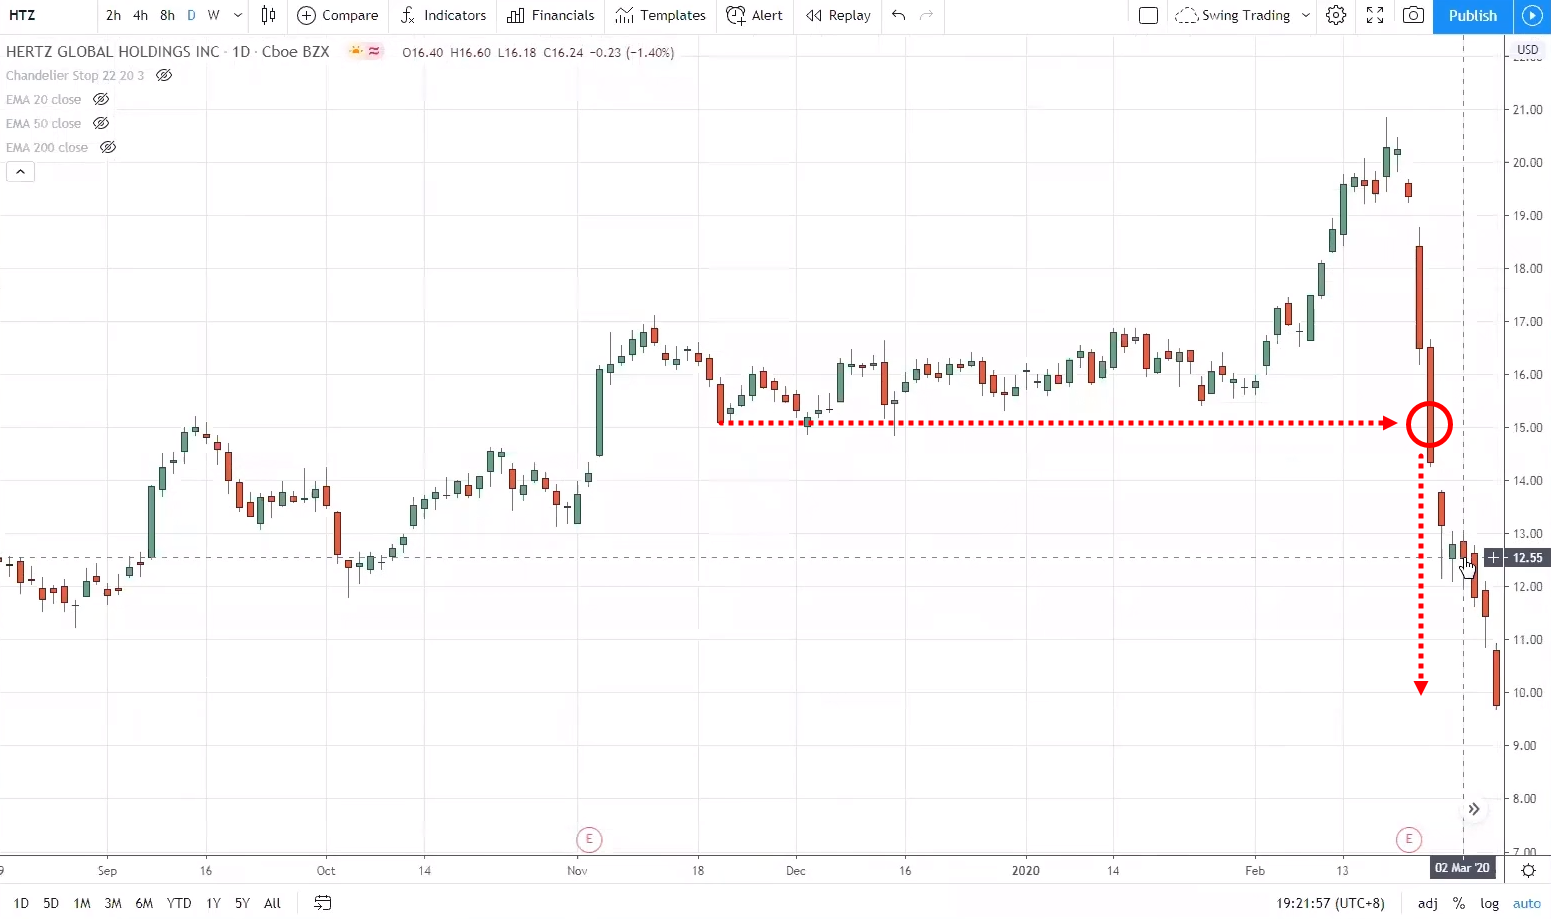
Even at this $12.55 area of support, the price managed to breakthrough after a small consolidation.
If you zoomed out the chart, Hertz has already been in a long-term downtrend. So really, the path of least resistance is actually already to the downside.
From a trend trading perspective, your trade should already be leaning towards the downside already.
So to answer your question, most likely I would take a short trade if I traded with the existing trend.
Take note that when a stock gets a lot of press release, it can get tricky because it can gap massively against you if there is news of privatization or acquisition. The stocks can gap up crazily. This is when your stop loss would have to be wider to consider those wild swings.
If you’re not comfortable, then just stay out of the market.
Again, the key thing I want to share is that the price leads the news. Even before the bad news came out, Hertz was already in a long-term downtrend.
What is the best way to set trade targets (take profit levels)?
If you’re a swing trader, you want to take profit before opposing pressure sets in. If you’re buying at support, then resistance or the previous swing high is where you want to take profits.
Hi Rayner, should we draw our support and resistance level/trendline from monthly to 4-hour timeframe even though I am trading off 4-hour timeframe as my entry timeframe and daily as my higher timeframe?
You can ignore the monthly timeframe because if you’re entering on the 4-hour timeframe, then drawing on the 4-hour and daily would be sufficient.
If you draw the area of support or resistance on the monthly timeframe, it could be a few hundred pips of difference compared to the ones drawn on the 4-hour timeframe. It’ll be difficult for you to trade off these areas if the difference is a few hundred pips wide.
Can I draw my support resistance on the higher timeframe either daily or weekly if I'm working off of 4-hour timeframe?
Yes, as I’ve mentioned above. The daily and 4-hour timeframe will be the most important ones to you.
Do you fund your accounts equally for both discretionary and systematic trading?
I have more funds in my systematic trading because of the circumstance that I’m in right now. For me, systematic trading is much easier for me because it doesn’t require much time and it allows me time to manage TradingwithRayner business. So for me, systematic trading eased the workload on me.
I still trade discretionary trading because I teach discretionary trading. I feel it’s only right for me to trade it and put money where my mouth is. It’s very difficult to do market analysis if I don’t have money on the line. That’s why I still do discretionary and answer to the price action students here.
What are the differences between those black and red level in weekly trading alert?
The black level is support and resistance drawn on the daily timeframe, the red level is support and resistance drawn on the weekly timeframe.
How do you screen for stocks or futures or currency pairs daily?
I do it on the weekly timeframe. I primarily trade on the 4-hour timeframe and above. A lot of my homework and planning is done on the weekends.
So when the market opens, I already know the setup that I want to be trading for the week. I draw the levels on Trading View platforms over the weekends.
How do I screen for it? I do it manually and eyeballing, since I know the setups I’m looking for, whether is it trend continuation trades or potential breakouts or false breaks, etc.
When to take profit or exit when the market didn't do as you expected? For example, if it goes on your favour but suddenly it comes back, do you take the profit or not, or still wait? In stop loss is also the same, are you gonna exit the trade even if the price is still not hitting the stop loss?
From what I’ve just read, it seems to me it’s about getting emotional about your trade. When you have a plan set in place, a pre-defined target, almost like a set-and-forget approach, then you shouldn’t be doing anything about it. It’s either going to hit your stop loss or take profit level.
However, I usually take an active approach like using a trailing stop loss.
For example, for swing trading, I have the first target. Then the second target is achieved through a trailing stop loss. If the price doesn’t hit my first target and then reverses against me, then I’m not going to do anything because my stop loss is already in place.
Let’s say the price has hit my first target, then I’ll exit my position partially and I will trail my stop loss for the remaining of my position. Then if the price hits my trailing stop loss, I’m out. If it continues to move in my favour, I will hold the trade until it hits my trailing stop loss.
Everything is planned ahead of time, so I’ll follow the plan. Don’t make decisions while in the trade because those decisions tend to be poor.
Hello Rayner! Regarding the risk management, we are advised to trade only with 1% of our capital for each trade. But what we do when we have, imagine 10 trading opportunities, if I enter these trades I will risk my capital 10%, that is correct? I can enter these 10 trades, or just enter one trade and wait to close the trade or eliminate the risk, and then I enter in the next trade opportunity? I'm asking this because in term of long term trading the probability to have more than 5 or 8 open trades is high, and I would like to know how to manage when we have a lot of trades opened and our account are exposed than more 1% of our capital.
You can split the risk among the few setups and so now you’ll have a reduced risk per trade.
Talking about trading timeframes, the lower timeframes, like 1-hour, 30-minute, or 15-minute, these timeframes aren't worth to trade due to the broker commission and spread or we just have too much noise and the strategies (like, false breakout, breakout, trend continuation etc... ) don't work so well?
For most major currency pairs, you can trade the 1-hour, 30-minute or even the 15-minute timeframes.
For example, you’re trading EUR/USD. Let’s say your stop loss is 25 pips and the spread is 1 pip. 1 pip out of 25 pips is just 4% of your stop loss.
As long as the spread that you’re paying is not more than 10% of the size of your stop loss, I would say it’s fair enough to take the trade.
Let’s say you have a 30 pips stop loss. Then that means the spread you’re paying cannot be more than 3 pips. So if the spread turns out to be 4 pips, I won’t take the trade as it’s more than 10% of my 30 pips stop loss.
This is one way to see which trade you won’t suffer too much due to spread.
For most major currency pairs, the spread is quite reasonable. And of course, you have to take into consideration your stop loss size. If you’re trading the EUR/USD, it can be a 1 pip spread. But if your stop loss is 5 pip, then that 1 pip spread is about 20% of your stop loss.
Anything more than 10%, I would usually skip the trade.
For exotic currency pairs, it’s usually worse as the spread is even wider. It’s hard to trade the exotic pairs on lower timeframes because the spread will eat up a huge chunk of your stop loss already.
So it’s not too much about the noise, but more because of the spreads that you end up paying that makes it less worthwhile to trade the lower timeframes.
Commissions, how we can handle the broker overnight rollovers swaps etc.? Sometimes we need to stay in the trade for several days, and our profits will be eaten every day by this swaps and rollovers, how do we handle this? Do we trade futures to avoid this? (Of course, sometimes we can go long and short and the swaps/rollovers are in our favour and that is good.)
If you trade forex, there’s really no way around it. It’s the cost of doing business.
Unless you pick trades that favourable rollover for you.
For futures and forwards, you can avoid this, like forwards on CMC, you don’t have to pay the rollover charges.
I want to know about best entries and exits, times to make money and which timeframes are the best to use.
There are no best timeframes or best exits. It really depends on your goal as a trader, if you’re looking to make a consistent income or to make a swing, capture a trend, etc.
From there, then you can choose the right tools and techniques to meet your needs.
There’s no such thing as the best one out there.
If I'm trading on the 1-hour timeframe, do I look at the 15-minute chart or 1-hour chart for entry? Which timeframe to draw support and resistance if trading off 1-hour timeframe, on the 1-hour or 4-hour chart?
If you’re trading off the 1-hour timeframe, then it will be your entry timeframe. What you can do is to use the 4-hour timeframe as your higher timeframe to get your bias.
You can draw support resistance on both the 1-hour and 4-hour timeframes, with the 4-hour acting as your higher timeframe, 1-hour timeframe as your entry timeframe. You can use different colours to mark out support and resistance
What is an appropriate timeframe for traders who would like to close the position before the end of the session?
Definitely below the 1-hour timeframe, probably the 5-minute or the 15-minute timeframe.
If you had to choose just 1 indicator, what would you use?
I will have to choose two, the moving average and the ATR. Because this is something that I use for my trading.
I use ATR to define the stop loss and the moving average to define the area of value, so I have to use both.
What are the preparations you do before the start of the trading week and how do you wrap up the trading week?
Identifying my setups for the week and create a watchlist on Trading View.
I wrap up my week by reviewing my positions, how did I trade, did I follow my plan, journal all these down, and that’s pretty much it.
Gaps on weekly charts vs daily charts: if I see a gap on a daily chart but not on a weekly chart, will the market still try to close the gap on the daily chart? - if the situation was reversed (cap in weekly, no gap daily), will the market try to close the weekly gap with ‘greater force’ because the gap is on a higher time frame?
The answer is, I don’t know. I have no idea whether a gap is going to be filled or not. I know there are textbooks that say that gaps have a 70% or 80% chance of covering, but I don’t find that to be true. That’s my honest answer.
I haven’t come across any reliable statistics that say a gap will be filled a certain percent of the time. A lot of it depends on the context.
Because if the overall market is in a strong uptrend, then it’s unlikely that the gap will be filled over the next few days, it could gap and go, and never come back.
Whereas, if the market is in a downtrend, and there’s a sudden gap up maybe due to short squeeze, then there’s a good chance the gap is going to get filled because the overall trend is towards the downside.
But again, I haven’t come across any statistics to say for a certain percentage of the time a gap gets filled.
Sure, people say the gap gets filled 80% of the time. But what if the gap gets filled only 10 years later? By then, you could have already blown up multiple accounts.
Multi-day engulfing patterns situation: the stock is in a downtrend and a series of large red daily candles have taken price into an area of support. Over the next three or four days after the last red candle, we see a series of small green candles with tiny wicks. If you visually consolidate the green candles into one large green candle, it looks like they push into 60% of the last red candle. On a daily basis, the reversal looks weak because each green candle is small (bulls lack conviction). But on a consolidated basis (higher timeframe), the reversal looks strong because the three candles have pushed into 60% into the last red candle. Questions: What’s the right way to interpret this, e.g. who’s in control bulls or bears? What are the trade strategy implications? For example, on the third small green candle open a long position (because one could expect a full engulfing pattern to emerge if two more small candles occur on days four and five? If so, should one the set stop loss at 1 ATR below the bottom of last red candle?
To determine who’s in control, it depends on the size of the wick. If the size of the lower wick is very long, then I would say the buyers are in control since they have already moved quite a long distance and pushed beyond the previous day candle by 60%.
Since the range of the candles is very small on the daily timeframe, then I wouldn’t trade it on the daily timeframe. If you want to trade this as a false break, then on the higher timeframe like the weekly, I want to see the price taking out the prior lows and then rejecting it strongly and then closing near the highs of the week.
If you’re unsure, then on the daily timeframe, you can watch how the price comes down lower, since you’ve mentioned that it has formed three green candles already. You want to see if the sellers have difficulty pushing the price lower or not, if yes, then it will look like a bull flag pattern where the pullback is relatively small.
That’s a good sign that buyers are coming in and taking control. I want to see the depth of the pullback, whether are they large or small candles to give me further clues.
But for your question, it depends on the setup you’re trading. If you’re trading a false break on the weekly timeframe, then you’ll just reference your stop loss using a swing low, using the lowest low at that point and set it 1 ATR below it.
When computing “strong” price rejection using the ATR method, do you include the wicks?
Yes, you want to consider the whole range of candles from the highs to the lows, including the wicks.
Counter-trend trading setup: how is this different to mean reversion setup?
If you’re referring to the mean reversion setup in Pro Traders Edge, it has statistical evidence behind certain markets that tend to revert at previous week’s highs or lows, or previous day’s highs or lows.
Whereas for counter-trend trading setup, it’s just simply trading against the trend when the price does a false break at the previous swing high or the previous area of resistance.
There's a line in the UPAT course that says, "look for clean moves into the market structure to avoid liquidity gap reversals". What do you mean by "liquidity gap reversals"?
Liquidity gap occurs when you see big moves in the market, where it swings up and down. Sometimes it’s due to lack of people participating in the markets, that’s why just a little bit of volume is enough to push the market higher or lower.
This spike is what we call a liquidity gap. There are not many transactions occurring at the point in time.
In a strong selloff, it could be due to a lack of buyers that caused the price to collapse into support. And if there’s a bullish price rejection or a false break setup, and you go long, then there’s a chance that the liquidity gap that caused the price collapse could be filled up as the price reverses up higher. This means the reversal could be equally swift to the upside.
This explains why I’m always looking for a strong power move into a level when I trade false break setups. Because the reversal could be equally swift in the opposite direction.
I tend to avoid stair-stepping price action into support. I rather see a strong bearish move, like what you see on Hertz earlier.
Does Heikin Ashi provide a greater advantage over candlesticks? Heikin Ashi makes the chart more readable. Will either of these two helps provided better technical analysis?
My honest answer is that I don’t use Elliot Wave or Heikin Ashi, I just have a very vague understanding of what it is. I wished I can comment more, but I can’t because I don’t use it.
I have quite a number of feedbacks from traders asking me to do videos on Elliot Waves or Fibonacci, but I’m not a trading encyclopaedia, so what I can do is to only share what has worked for me.
Should we ignore forex news in making our trading decisions because sometimes the expected outcome of the news does not necessarily reflect the movement of the pair?
Yes and no. If you’re a short term day trader, then the news is important to be aware of, because you want to get out of position before the news comes out, before the spread widens and you get stopped out of your trade for nothing. I think it’s applicable if you’re trading on the lower timeframe.
But if you’re a longer-term trader, trading off the daily timeframe, week timeframe, then you can just ignore the news. Because as mentioned, I believe the price leads the news, and everything is already embedded in the price.
And since you’re trading off the higher timeframe, your stops are wider, they will be more than enough to accommodate the swings that are created from news release.
Based on your experience, can you elaborate more on how the "bankers" manipulate the forex market? How do we identify and follow the banker's movement?
For those people whom I know, who trade for the banks, they trade as a market maker and provide liquidity to the institutions. I have no idea how they manipulate the forex markets.
Because for banks, their primary role is to provide liquidity to the institutions, the hedge funds. If the hedge funds want to buy a billion-dollar worth of EUR/USD, the bank trader has got to give them a price and see if the price meets the hedge funds’ needs for them to take up the offer or not.
That’s pretty much what bank traders do.
Do you recommend incorporating indicators into price action trading? If yes, what are the examples of indicators do you recommend?
Yes, I use moving average to define an area of value. I use the ATR indicator to help me set my stop loss. I also use the Chandelier Kroll Stop to help me trail my stop loss.
All these are part of my price action trading. They are just tools to help me manage my trade and define my area of value. They are not tools that form the basis of my trade.
Do we have to trade different pairs at a different time of the day (e.g. when the particular market is most active)?
This would be most applicable if you’re a short-term day trader. If you’re trading the Asian session, then the Yen pairs will move more compared to the EUR/USD or the GBP/USD.
If you trade the London, New York sessions, then you want to focus more on the volatile pairs like EUR/USD or GBP/USD which tend to move the most during those sessions.
But for a longer-term trader using the 4-hour, daily or weekly timeframes, it would be irrelevant.
In Chapter 6, to determine whether a market tends to trend or range-bound, the test was as follow: buy the breakout of previous day high, hold the long position until the price hits the previous day low and go short, then hold the short position until the price breaks above the previous day high and go long. I am trying to re-create this test and would like to clarify when you mention buy the breakout of previous day high, do you do so after the close of the next candle? E.g. Day 1 high is $10, day 2 high was $10.50, close was $10.30. 1. Do you buy on day 3 market open? 2. Do you buy on day 2 (intra-day) the moment it breaks $10? Thank you.
This test was done on an intraday basis, so the moment it breaks the previous day high, it will automatically go long. I believe the backtest was done on Multi Charts or Trade Station. I got a developer to help me with that one.
Hi Rayner, can you explain a bit about your trailing stop loss? Sometime back you used to base on the previous high/low, and sometimes it's the chandelier exit. Just wondering whether there is a particular reason for using different trailing stops.
I’ve now lean towards the Chandelier Kroll Stop because I find that it’s more objective based on the volatility of the market.
Previously I was using previous days’ highs or lows, but sometimes, the range of the candles of the previous day can be really large or really small and that’s not really very objective.
Because if the range of the candle is small, there’s a high chance you will exit your trade earlier. Or if the range of the candle is large, then your stop loss will be higher.
So I went with the Chandelier exit because it’s more objective as it takes into account the average true range of the market, I can use 3 ATR, and for me, it makes more sense.
Which is true: the more the price touches support resistance, the stronger it is? Or the more the price touches support resistance, the likelier it is to break?
My take is that the more times support resistance is tested within a short period of time, the more likely it is for support resistance to break.
In other words, if you see a descending triangle coming into support, there’s a good chance that support will break. If you see an ascending triangle going into resistance, there’s a good chance that resistance will break.
When doing a false break, is a price rejection of 1.5 ATR necessary?
It’s a good filter to define a strong price rejection. Ideally, I want something that is strong and my false breaks to be of 1.5 ATR.
It’s good to have it, but if not, I also look at other factors in play to see if I want to the trade. Especially if the higher timeframe is in an uptrend, and volatility is contracting in the higher timeframe, then I will still take the trade anyway.
Do we refer to your ranking.xls in future for trending markets to be used in the systematic trend following system?
No, I don’t use that, that’s a separate thing altogether, so don’t confuse the two.
How would you recommend systemizing the Ultimate Price Action Trader?
For price action trading, there’s only so much that you can do to systemize it and make it objective, like defining the 4 stages of the market, identifying the area of value.
But it’s not possible to make it 100% quantitative, because there’s an element of subjectivity over there. Because there’s no way to draw support and resistance, or trendlines objectively.
That’s why quantitative trading and discretionary trading are separate fields. If you want to learn more about quantitative trading, then that’s where the Ultimate Systems Trader (UST) comes into play.
There are different needs for different traders.
What system do you use to record your trades?
I use Excel to record my trades. Primary metrics that I use are:
- Currency pair
- Entry
- Stop loss
- R-multiple on the trade
- Type of trading setup
- The profit and loss
Have you done any backtest on the best way to exit a trade: to let winners roll or taking profits at set levels?
The similar testing that I’ve done are the ones on market behaviour. So certain markets have certain characteristics.
For example, GBP/JPY is a trending market. So whenever the price breaks above the previous day highs, there’s a good chance that it will continue. So in such markets, it makes sense to trail your stop loss because it has a trending behaviour.
But for markets like AUD/CAD, GBP/CAD which have a mean-reverting behaviour, where they tend to reverse after reaching its previous day highs, I recommend not to trail your stop loss, but to capture a swing instead.
I have not done any backtesting on the best way to exit a trade. Because different markets have different behaviour. If you want to take statistical analysis into consideration, you want to consider your trailing stop loss on markets that tend to trend, and then capture swings on markets that tend to reverse at previous day or week high and low.
I’ve just completed the course, and one of the things I’ve learnt is that the previous day high or low can be used as an area of value if I’m trading on the 1-hour timeframe. I’m wondering if relying on those levels is enough, or should I draw my own levels?
Yes, I would say, still draw your own levels as well. It’s good to have confluence, where your own support and resistance levels are aligned with the previous days’ highs or lows.
The previous day high and low are useful for those markets with mean-reverting behaviour, like AUD/CAD, GBP/CAD, GBP/NZD. Have a look at the market behaviour module where I shared which markets have a mean-reverting behaviour and which has a trending behaviour.
What happened to the Trend Following Mentorship Program? Is the system still valid for today’s markets?
I still trade the systematic trend following system, the breakout of the 200-day highs, with 6 ATR trailing stop loss. It hasn’t been performing well over the last few years, and that’s only one of the systems that I do trade.
The reason why it hadn’t been performing well is because systematic trend following tends to do well in a crisis period when the market is in a recession when the stock markets are not doing well, this tends to provide a buffer or a hedge during those times.
But over the last 10 years, the stock market has been in a huge bull run. This year, we had a 30% drop in the equities market and the systematic trend following did brilliantly during that period, I think it was up double-digit during the market collapse.
Now the markets have reversed into the all-time highs, and so the systematic trend following has given back quite a bit of the gains. That’s why I say it tends to do well during markets turmoil.
For mean reversion, do you still trade it if the market is trending?
What you can do is to look to buy the previous day low or the previous week low. You’re still trading the mean reversion element but you’re trading in direction of the longer-term trend.
When drawing trendlines on different timeframes, does the higher timeframe carry more weight? Once the trendline is broken, do you generally disregard the trendline?
Yes, the higher timeframe one carries a higher weighting because it will have a stronger price reaction.
Once it’s broken, I’ll try to adjust it. But if it’s really broken and destroyed, I’ll just remove it from the chart.
Can you recommend the best forex broker for people in India?
I wish I could, but I think forex is banned in India, so I think my recommendations will be limited.
But the ones I usually recommend are IC Markets or Blueberry Markets, these are reputable ones. I’m not sure if you can open an account in India.
Do you have the Mac version of the risk management application?
I think you’re referring to the risk management calculator Expert Advisor on MT4. Based on the programmer, she said it should work on Mac. If it doesn’t, could you write a ticket to support@tradingwithrayner.com and let’s see how we can work things out.
Any YouTube video on how to use the Chandelier Exit?
The Chandelier Exit is just a trailing stop loss tool, I think you can just do a search and see what comes up. I don’t have any video on it, so some other trainer might have to fill the gap on that one.
What’s the best strategy for Gold?
There’s really no best strategy out there, but what I can say is that Gold is a trending market based on our statistical analysis. This means that whenever Gold price breaks the previous day high, it tends to continue in that direction.
So that market is suitable to be trading trend continuation, breakouts, false breaks in the direction of the trend.
What do you think about the ADX indicator?
All I know is that the ADX is a trend indicator, but I don’t really understand the math behind it. So my comments on that are limited as well.
I wish I can comment on that, but my niche is really on price action trading and systems trading.
There are a lot of things I do not know, like for example, people asked me about Elliot Wave and Supertrend indicator, ADX, these are stuff that I do not know since I didn’t study them in-depth as they were not really relevant to my trading.
I believe there are materials out there to answer your questions, so have a look and see if that makes sense to you.
Do you trade the Singapore markets? If no, why?
I trade mainly the US markets for stocks and ETFs because US markets are more liquid, and I can semi-automate my trades using Interactive Brokers for the US markets.
US markets data are more readily available compared to Singapore markets, where getting accurate historical is something difficult.
What’s the best strategy for systematic trading?
There is no best trading strategy because no one strategy works all the time. Some strategies like systematic trend following favours crisis periods. Whereas momentum trading strategies will do well in a bull market, and it’s going to get crushed in a bear market.
So there isn’t the best trading strategy out there. Different trading strategy seeks to exploit certain behaviour of the market.
This is why I trade multiple strategies because there is no way to tell which strategy will perform well next year. I do not know, that’s why I diversify across different systems and strategies, and price action trading is just one of them.
Is the Trend Following Mentorship Program similar to the Ultimate Price Action Trader?
Yes, it’s similar, the TFMP actually came out first, before the UPAT. The materials are very similar.
For TFMP, I had a closer mentoring approach where I took in a small group of traders and we had more communication and group coaching sessions. But afterwards, I couldn’t find time to mentor and that’s why I branched off to UPAT, where it’s more of an online trading course.
But in terms of the materials, they are largely similar.
Which broker do you recommend for US traders?
It depends on what you’re trading. If you’re trading stocks, then I would say Interactive Brokers. Thinkorswim is pretty decent too.
For forex, I think the US has its restrictions as well, so, I have no idea. I usually recommend IC Markets and Blueberry Markets. These 2 are the better ones in forex and more reputable in terms of reviews. I’m not sure those work in the US.
I think you can open IG markets in the US, but their spread seems to be wider than the competitors.