
I am facing a problem in screening the stocks. Can you please share the rules to be used for screening the stocks? I will look for trade setups discussed in the UPAT (false breakout, counter-trend, breakout, trend continuation) of listed stocks only.
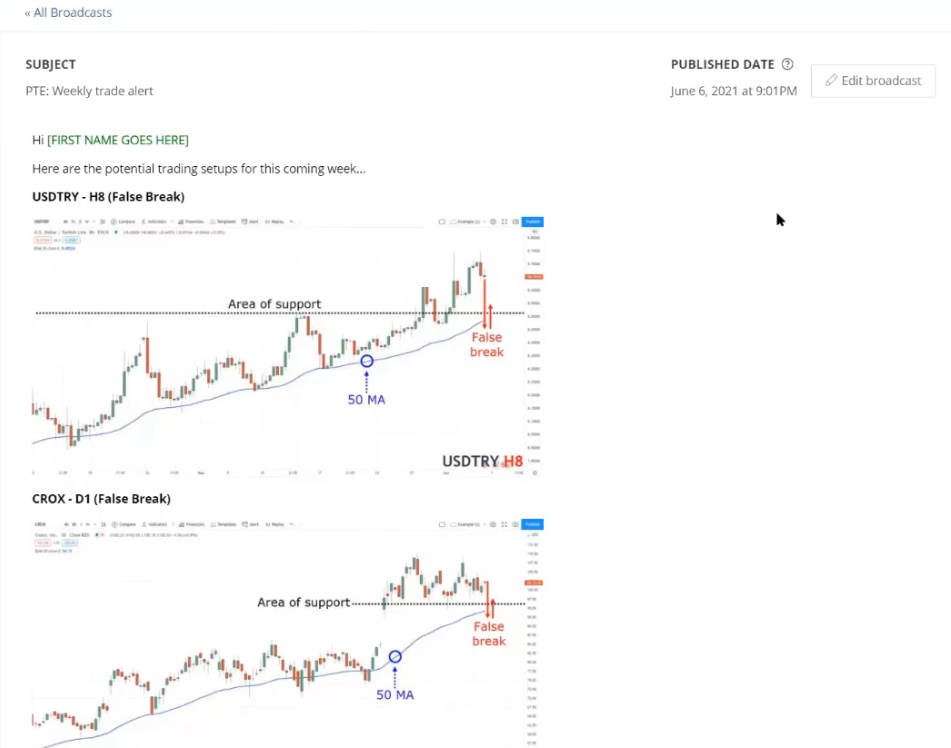
My bread and butter setup that I look for is the false break setup, which is easy to use Finviz to screen.
For those of you who are not familiar, these are the settings I use on Finviz (technical settings):
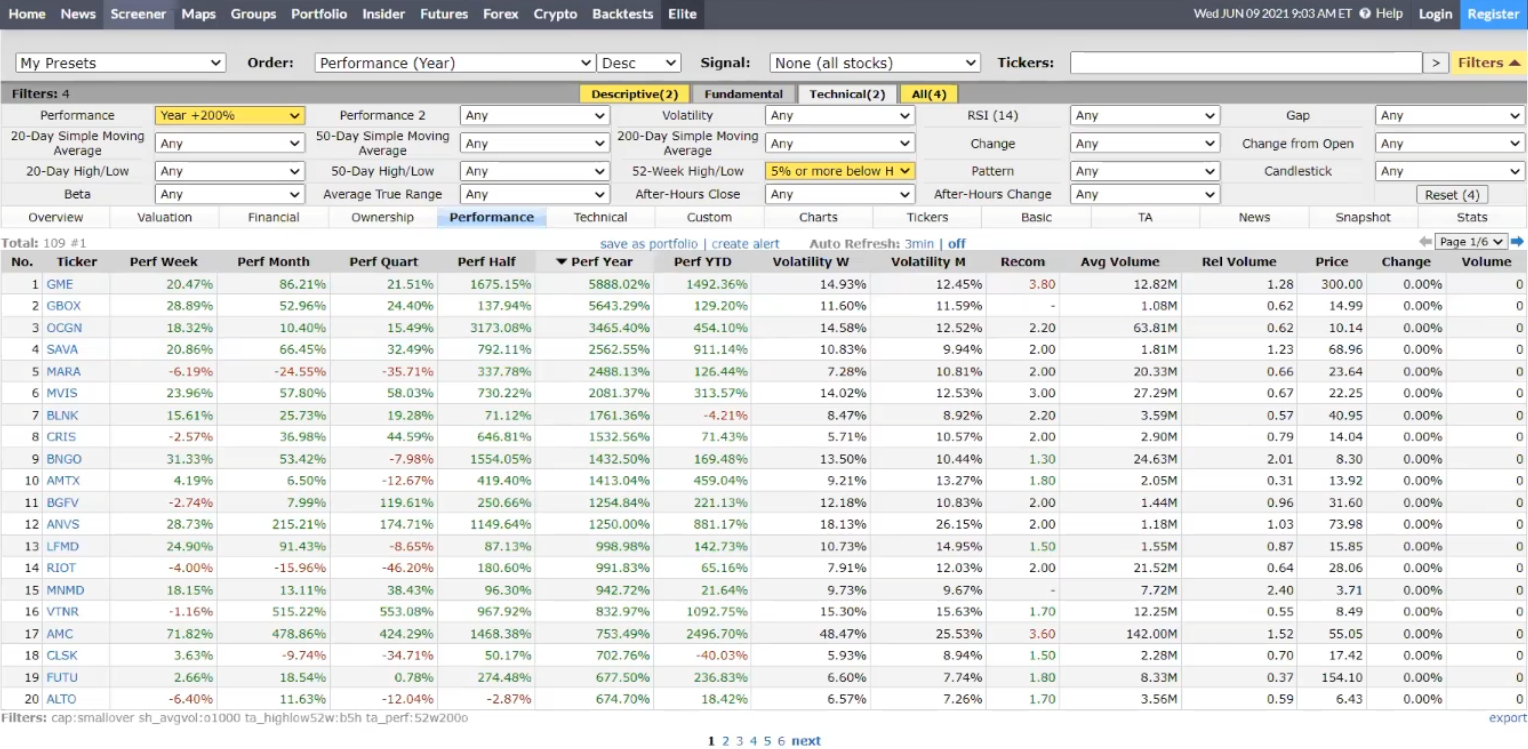
At the top left, I’m looking for stocks that have increased at least 200% a year. This tells me that the stock is likely to be in an uptrend, and I want to focus on buying these stocks which are in an uptrend.
If the market has been really strong, I might increase that to 300%. You can play around to see if you want 200% or 300%.
Next, I look for stocks that are 5% or more below the 52-week high. This means that they’re likely in a pullback right now.
These are the settings I use for Finviz (descriptive settings):
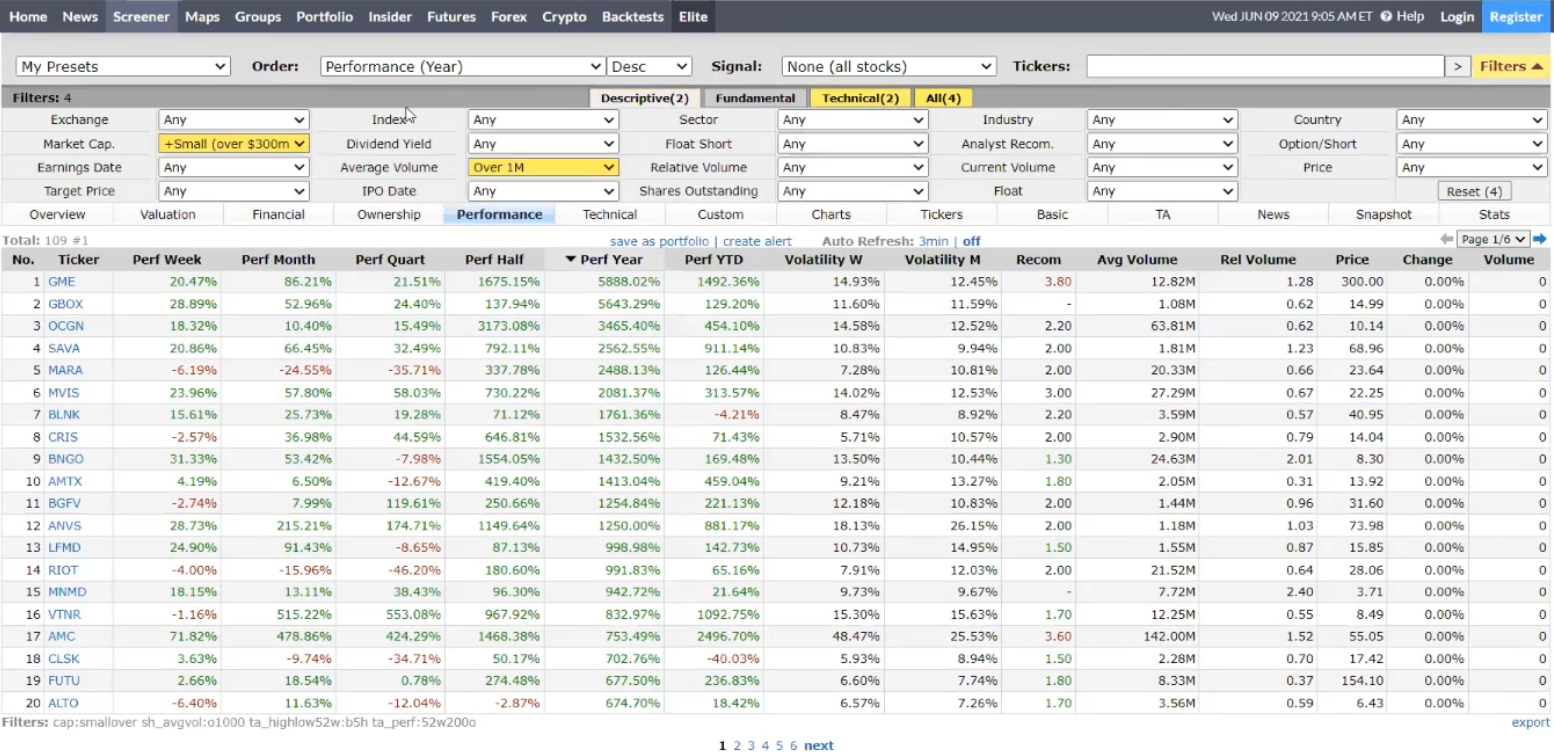
At the top left, I’m looking at companies that are above $300 million in market cap. Volume is at least 1 million so I’ve no problem entering and exiting my positions.
You can see that the stocks are ranked according to their “Perf Year”, which is the performance for the year.
Next, I go through all these tickers one by one and see which one of them has the setups that I had taught in the UPAT.
TradingView’s screener is not as comprehensive as this, so we’re not able to use such a screener on TradingView directly.
Can you please explain to me what is ROC?
The rate of change measures the percentage of change of a stock over a period. If you use a 50-week ROC, then that measures how many per cent did the stock rise or fall over the last 50 weeks.
Do you have signals, planning to have, or would you recommend anyone?
I don’t have any signals per se, but the closest I have would be the Pro Trader’s Edge’s trade alerts where I send out potential trading setups that I’m looking at ahead of time.
Would it be useful for me to learn how to read level two data effectively for when I'm buying breakouts or would it just add confusion? Thank you.
I find that level-two data is more relevant to day traders and scalpers. If you’re a longer-term trader trading on the daily timeframe, then it’s not necessary for you.
What is trading short, and what advantage is it and do you need a margin account in most cases for this?
Basically, trading short is the opposite of trading long. When you short, you’ll make money when the price goes down. The advantage of shorting is that even in a bear market, you’ll make money.
Hi Rayner, are there any specific patterns that are particularly misleading? For example, in my own experience, I've seen a lot of descending triangles (lower highs into support), break out on the upside. But you have a broader experience than me so keen to get your comments. Thanks.
For me, the descending triangle is a sign of weakness and I expect the price to head down lower. Depending on where you get your source of information from, some people say that descending triangle is a sign of strength as it could breakout to form higher highs.
A lot of patterns are not misleading per se, but they are used in the wrong context. If someone talks about head and shoulders pattern in an uptrend, and they look to go short once the price breaks below the neckline, then that’s not something I’ll readily agree with.
Because you have to look at the context of the market and determine the trend. If the trend has persisted for the last 300 candles or so, while the head and shoulders pattern has only formed for 30 candles or so, then what are the odds that this head and shoulders pattern will reverse the entire uptrend?
To me, chances are low that the head and shoulders pattern can negate the entire uptrend.
But let’s say the uptrend is about 100 candles, while the head and shoulders pattern is 150 candles, then you can see that the head and shoulders pattern is more significant now as it takes a longer time to form.
Context matters, and you shouldn’t be using the candlestick patterns blindly.
Rule-based discretionary trader vs systematic trader, who has the higher potential to produce higher expectancy trading result? Are the best traders discretionary or systematic?
From my experience, I’ve seen discretionary traders have a high expectancy relative to systematic traders. But that doesn’t mean discretionary trading is better than systematic trading.
If you look at the richest traders in the world, they’re mostly systematic in nature.
And also, the word ‘best’ here is subjective, because do you define ‘best’ as making the most money?
Discretionary traders have do have a higher expectancy of trading results than systematic traders. But in the long run, systematic traders are the ones who make the most money.
Based on your experiences, what is the accuracy or expectancy of a trading strategy using the false break setup? You may reference your timeframe.
For me, it’s about 60-65%. But bear in mind, I trade the stock markets as well, and the stock markets have been trending upwards over the last few years and that probably skewed my results towards the upside.
For stocks, it’ll mainly be the daily timeframe. For FX and commodities markets, it’s usually the 4-hour, 8-hour and daily timeframe.
Another thing to note is, 65% is achieved from taking half my profits off before the swing high or swing low. I will hold the remaining half of my position to ride the trend.
Among the following: trade setup, entry, trade management and exit. Which is the most important? And why?
It depends. If you’re a trend follower, what’s more important is your trailing stop loss and exits, and the number of markets that you’re trading. Because the more markets you trade and if you use a trailing stop loss, it will increase the odds of you capturing a trend.
If you’re a trend follower, whether you trade breakouts of the 50-day high or 60-day high, those are not as important trading more markets and setting a trailing stop loss.
On the other hand, if you’re a mean reversion trader, if you want to buy the pullback and sell the rally, what’s important is your entry. Because if your entry is wrong and you time your pullback poorly, you’ll encounter many losses because your stop loss is usually not as wide as a trend follower.
It depends on your trading strategies.
Some argued that random entry would work with the stock market if you focus on exit management. Do you agree?
Yes, it could work if you have a trend filter and you are selecting the right stocks like the strongest stocks in the stock market. However, if you’re randomly buying stocks including those in a downtrend, then I would say that random entry wouldn’t work.
Yes, the entry can be random, but you can see that other conditions need to be met before I go with the random entry.
How long did you take to become a profitable trader?
It took me about 4+ years to be profitable, it took me a lot longer like 8-10 years to be consistently profitable.
Consistently profitable took a while as it took me time to grow the account size.
What would be your advice to traders, who are applying trading strategy with an edge in the market, right psychology and position sizing but showing below average results? How to improve for such traders? E.g. Reducing their mistakes.
My advice is that if you know that you’re trading a strategy with an edge, but your results are still not good, then reduce the position size first or reduce your risk per trade.
You might have an edge, but if you’re risking an amount of money that you’re not comfortable with, then you’ll tend to doubt yourself because the money on the line is too great for you to handle.
My suggestion is to decrease the position size or lower your risk per trade from 1% to 0.5% per trade. 1% is a good guideline but it doesn’t take into consideration the size of your account.
If let’s say your entire net worth is $100,000 yet you have all of that in your trading account and you’re risking 1% per trade, then you’re technically risking 1% relative to your net worth, and that’s a lot.
Bring that size down to something that you’re comfortable with and let your edge play out. Once you see your trading strategy start making money for you in the long run, then you’ll have the conviction to scale up the size of your trading account.
In your courses, you teach about the MAEE formula. Recently I've discovered on my own about the Volume Profile. Would you consider using the Point of Control as a possible definition of "Area of value"? If so, can you elaborate, if not why?
I’m not an expert volume profile trader, but from my understanding, the point of control is the area on the chart where the most amount of transaction volume has taken place.
That usually coincides with classical support resistance on the chart. Therefore I usually just look at support resistance and not the point of control.
Also, I find that volume profile matters more to shorter-term traders and day traders. Where they use that tool to help them make trading decisions.
How to overcome painful feeling when reviewing my trades?
I’m guessing it’s painful for you because you’re reviewing the losses on those trades. I don’t have an answer for this because I don’t experience that kind of pain when I review my trades. What I felt was enlightenment as to why I had such losses and I discover patterns that led to these losses.
About the false break strategy, I'm a little lost when you say clean move, if the price approaches an area of value, should it be 2 to 3 bullish or bearish candles? How about if the candles approaching the area of value is 5 or 6 bullish candles, is that still a clean move? Thanks in advance Rayner.
This depends, if you’re looking to go long, then naturally the clean move would be a series of bearish candles coming into support. But if it’s a downtrend then it’s going to be the opposite, where you’ll see a series of bullish candles going into resistance.
A clean move isn’t dependent on the number of the candles but rather, the size of the candles. The larger the bearish candles are when they come into support, the better it is for me. It will allow the market to swing back up in my favour when there’s a false break afterwards.
What I avoid is a series of choppy moves with lower highs into support, I don’t want that. I’d rather look for one big strong move into support to look for a false break at support or reversal at support to go long.
Noted that there are some modules such as bonus modules without video. Will you be uploading them? As I find that video helps in the learning more than the transcript. Or even an audio file works as I can listen on the go to give myself a constant reminder of finding and determining my edge and trading strategy.
The bonus modules are extra content that I’ve written that I find would be useful to the UPAT members, there weren’t videos dedicated to those and hence I call them bonus videos because they’re like additional pieces of content that I’ve written that I think will enhance your learning in the UPAT.
Is it possible to mix UPAT with UST to improve the returns?
Yes, it’s possible but bear in mind that the UPAT and the UST they’re two very different programmes. The UPAT deals with discretionary trading and there’s an element of subjectivity while the UST is completely black and white with clear, concrete rules.
Having both of them can improve your overall results because the UST focuses a lot on the stock markets and ETFs, whereas the UPAT course is used by traders more on the FX markets.
What markets do you think a beginner should start with?
There’s no specific market that a beginner should start with because there’s no such thing as a market that is easier to trade than the other market.
Do you recommend the UPAT to be applied on crypto and any recommendation on how to do so?
I don’t trade cryptocurrencies but I do see the chart of bitcoin from time to time, and you can apply the trading strategies and concepts to cryptos as well.
For cryptos, the timeframe matters a lot. Because on the daily timeframe, it could be in a downtrend, but on the lower timeframe, it could be in an uptrend. Therefore, you want to be trading the timeframe that you are on.
I have finished the UPAT course modules. What should I do next? (e.g. follow your YouTube videos? Read the books recommended in the resource section?)
I suggest that you watch the Pro Traders’ Edge weekly report, and you will see how the concepts and strategies that I’ve taught in the UPAT are being applied in the real world of trading.
Is there any advice in setting the buy limit to enter a trade to get a better entry price? Like how many cents lower from the next candle open or previous candle. Thank you.
I don’t have a fixed rule like 10 cents or 5 cents below. Because different stocks have different volatility. 10 cents might be a lot or too little depending on a stock.
Maybe a better approach is to use the ATR indicator. Maybe you want to use 0.1 ATR above the previous day closing price to place your buy limit order.
Can you share more about trading strategy in more detail when the price goes into a range market in a previous trending move? Since price often consolidates and continues trending move again, so it is difficult to tell when the trend is going to end and which is accumulation or distribution stage. For example, if there is buildup leaning against a range’s top resistance in a downtrend, will you choose to long on the breakout to expect trend reversal or go short to expect the price to continue travel back inside range? Because it seems to me both are valid setup.
When I spot a potential accumulation or distribution stage is look at the number of candles the price takes to form the range.
For example, I was looking at the USD/CNH:
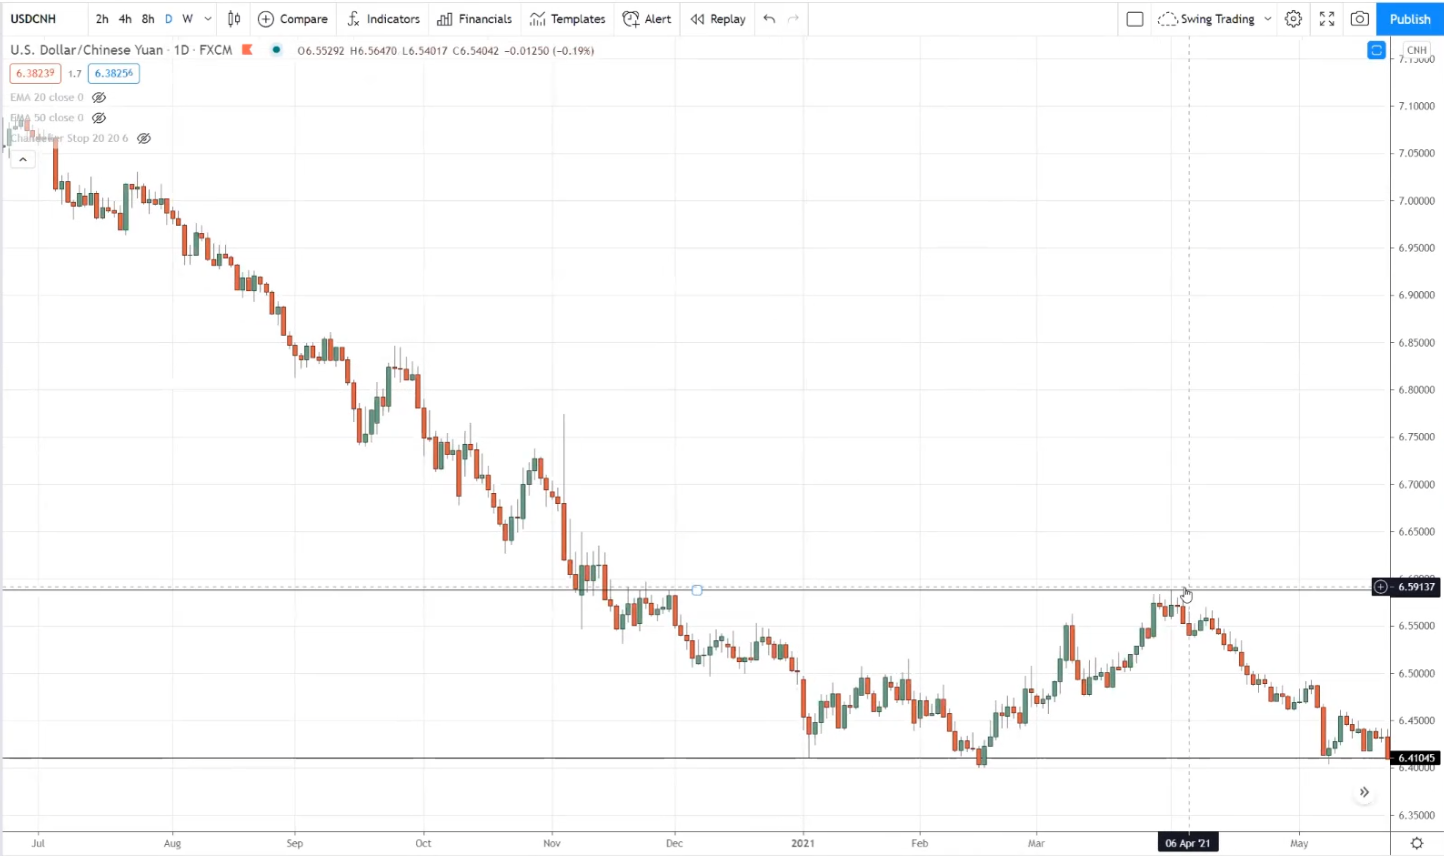
To me, this chart is potentially in an accumulation stage. But we can only confirm if the price can break and close above the 6.58 area of resistance.
I see this as a potential accumulation stage because there are about 131 bars in the range.
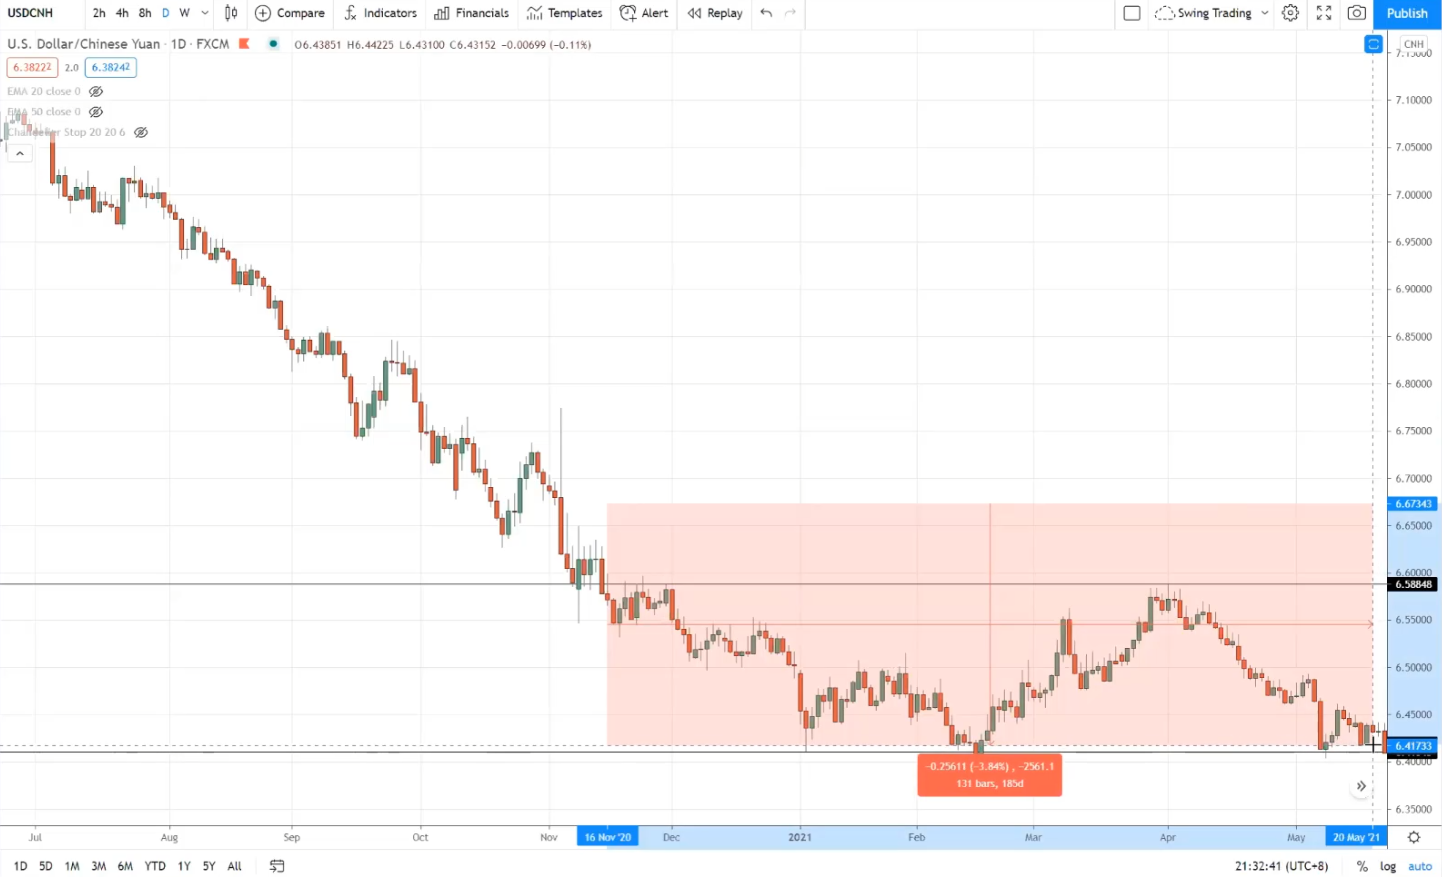
Usually, I look for around 80 candles in a range to determine if it’s in an accumulation stage. So to me, the example above is in an accumulation stage.
I would shift my bias from bearish to bullish if the price can break and close above resistance.
Also, if there’s a buildup that could be formed near the 6.58 price level, I would then overlay that with the 20MA. If the price can break out of resistance, I will be looking to buy.
Of course, that didn’t happen for USD/CNH, the market eventually broke down and tested previous support at 6.41 instead.
Looking forward to seeing Nifty and Bank Nifty as examples.
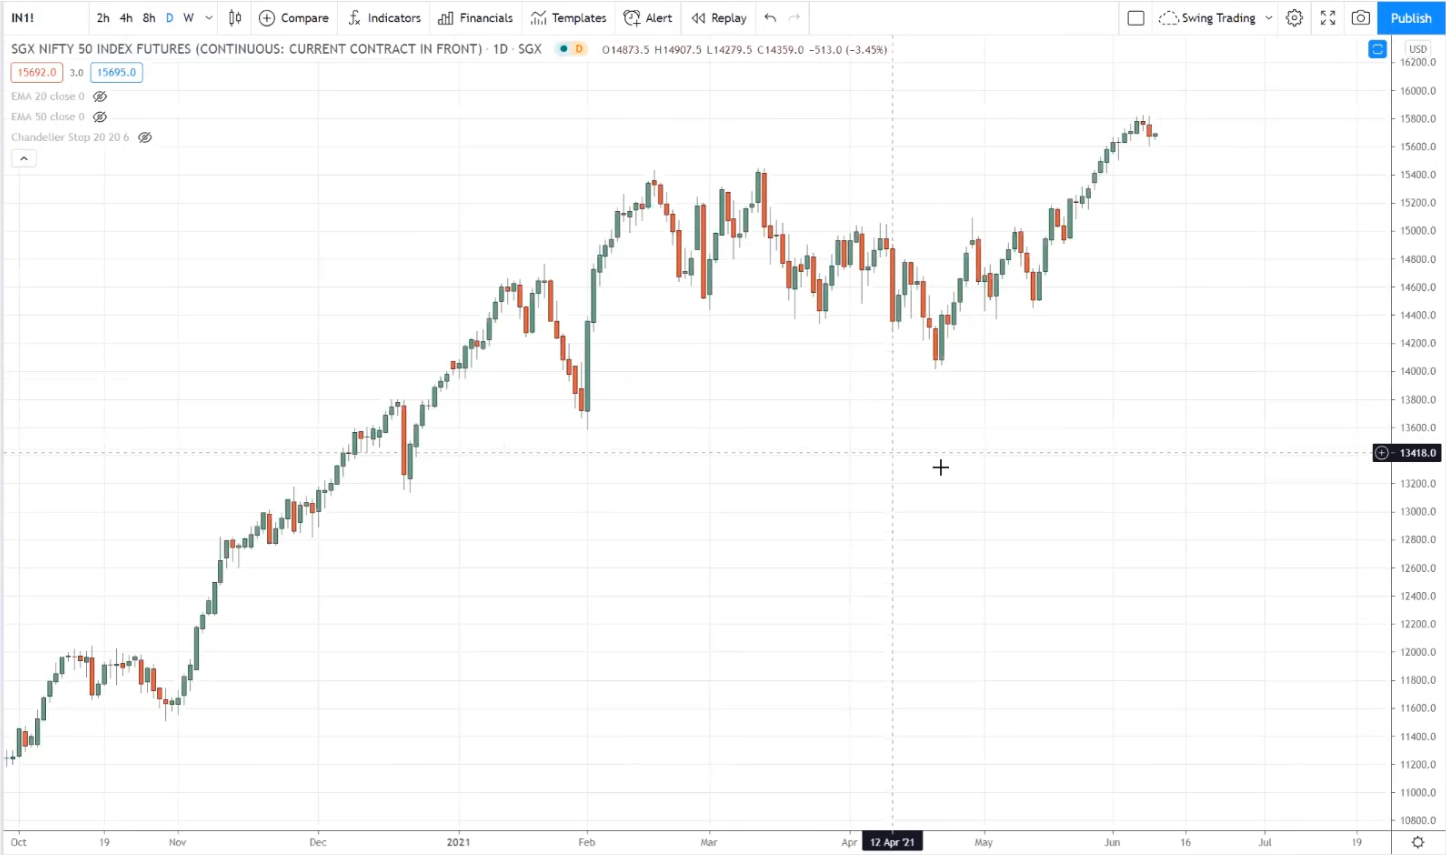
You can see that the market is bullish and is in an uptrend, there’s no reason to be bearish. Next, you can identify the areas of value.
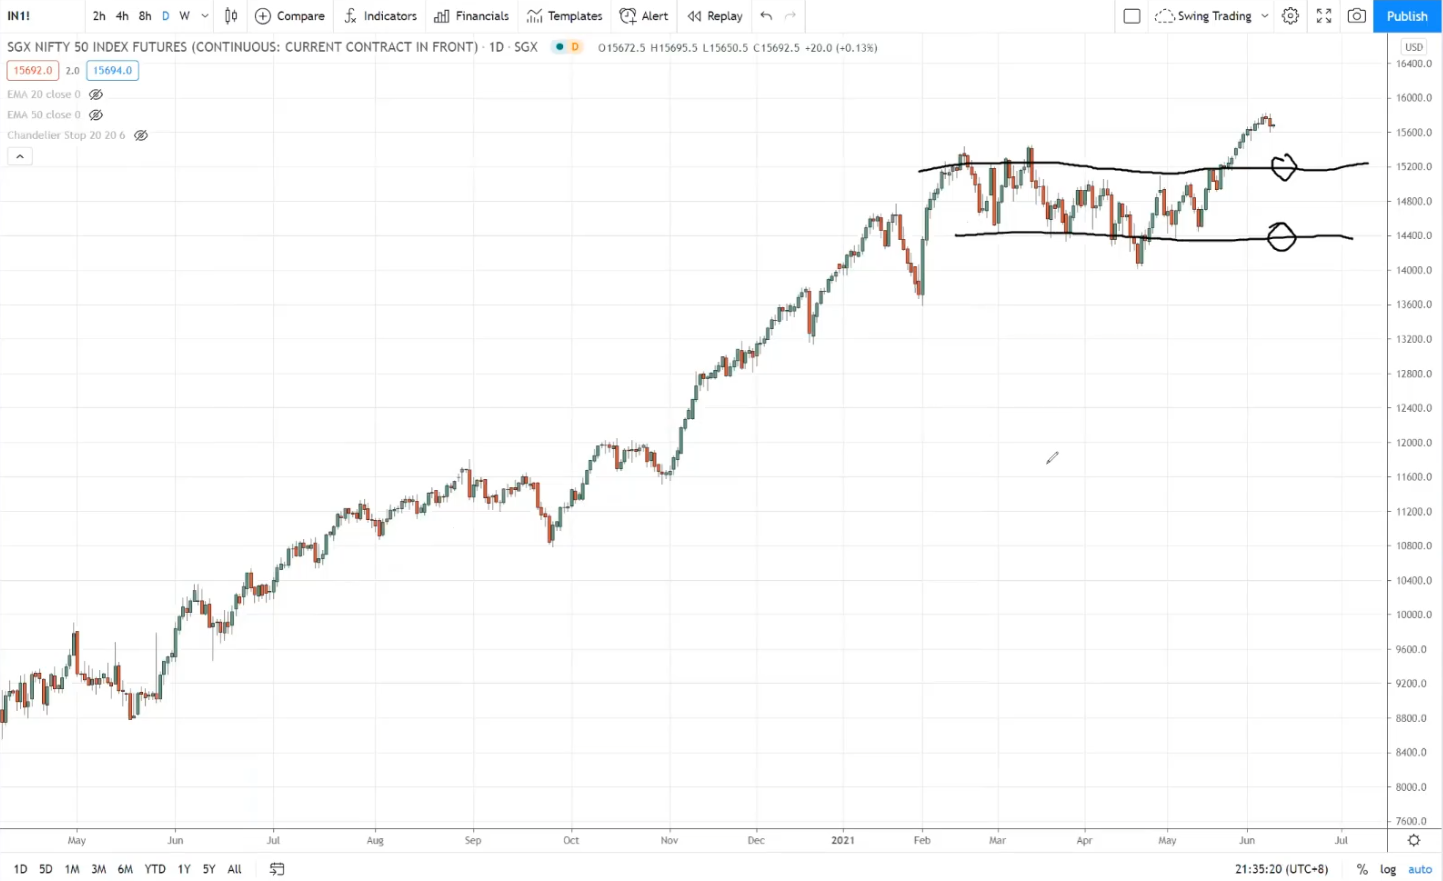
You can see that the 15200 area could potentially be resistance turned support while the 14400 area is likely support.
What is TradingView, and how is it used?
TradingView is basically a charting platform, I’ve done up a tutorial on that so you can check that out here: https://www.youtube.com/watch?v=Vqrkbcdmuqc
After doing a trading journal, if I have losing trades, what do I do with my trades?
When you have a trading journal, it’s very important to be trading the same particular trading setup over again.
Let’s say in your trading journal and you have 50 false break setups, and out of the 50, you have 35 losers. Then you want to ask yourself what’s wrong. The first thing you want to look for is a pattern.
What are some of the similar patterns that make you lose money?
One of the common reasons why many traders lose is because they’re usually trading against the trend.
Secondly, their stop losses are too tight and didn’t set a proper stop loss which is usually away from the price structure, like 1 ATR away from support or resistance.
When you have these two, the losses are usually reduced by quite a bit.
Any recommended brokerage accounts to trade for multiple assets?
To be honest, I use CMC to trade FX, forwards and futures. I use Interactive Brokers to trade stocks. But if you want a brokerage to trade FX, stocks and the rest, maybe Interactive Brokers might allow you to do that. I’m not sure if they offer cryptocurrencies.
If you want a one-stop-shop, you’ll likely have to go with a CFD provider because they usually offer you a variety of products to trade.
Of course, CFD brokers have their pros and cons as well. I’ve written an article about it before, so you can check it out to understand what you’re getting involved with: https://www.tradingwithrayner.com/forex-broker/
For the Finviz screener, can you list the filters we play around to screen for trending stocks, like the minimum we can play around to obtain trending stocks?
I go with small-cap because I find that I get more trading opportunities, but not all traders are comfortable trading the small caps because the gap and volatility could be higher.
I also have another rule where I have at least a million shares traded, so I can, you know, identify those stocks that can quickly get me in and out of stocks.
If you want to be safe, I'll say the mid-cap is safe for most traders because the market cap is at least $2 billion.
A far base to look at is at least 200%
But again, if the market is in a recession in a downtrend, you will get very few stocks that appreciated more than 200%.
If the market is in a downtrend recession, then maybe you might be just holding on to cash and not trading at all.
The Finviz link you just shared now, what type of pattern you're looking for?
For a Finviz link, what I usually would get is stocks that are in an uptrend. A couple of patterns I trade is primarily a false break in an existing uptrend.
That's like 80-85% of my trades.
Sometimes I could also get a trend continuation trades like a bull flag or even a breakout with a build-up but not as often as a false break setup.
Do you close your FX positions before the significant market-moving event, like major rate decisions, inflation data, etc.?
The answer is no. Because when I trade FX, the timeframe, the lowest timeframe that I'm on is usually the four-hour time frame.
I'm mainly on the eight or even the daily timeframe. My stop loss is wide enough to accommodate terrible news.
Most of the time, most of my position positions are trading in the direction of the trend, usually when there's big news coming out, more often than not.
That news helps the market push further in the direction of the trend.
To answer your question, I don't exit positions ahead of time, even before the major news release.
For false break setup, do you always recommend setting a target profit, and why?
When I trade the false break setup, let's say I buy a false break at this area of support.
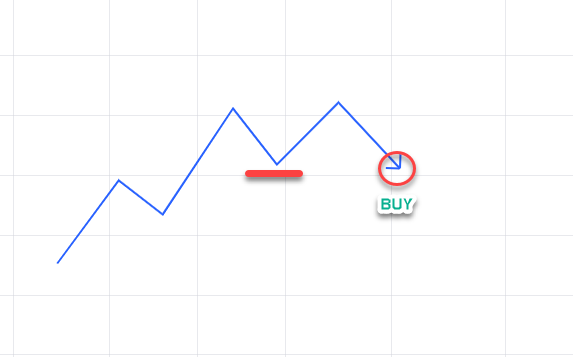
I will look to at least target the most recent swing high, in this case...
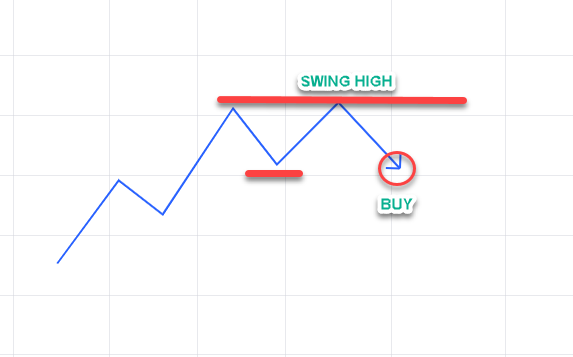
If the price comes up and reaches this swing high...
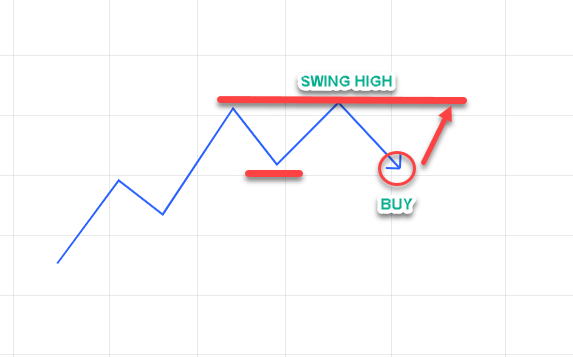
I will take a half position off. But let's say what if the price doesn't get to this high?
What happens next? This is more like trade management.
If the price rises, almost reaching the swing high but didn't test it, they come down lower:
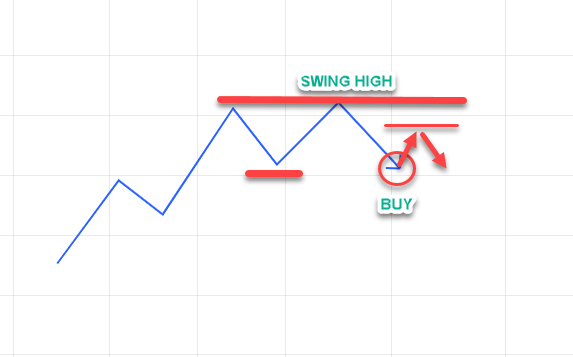
At this point, how do I shift my stop loss? Or do I continue holding the trade?
I wouldn't shift my stop loss yet, because my stop loss is slightly 1 ATR below this support, probably somewhere here...
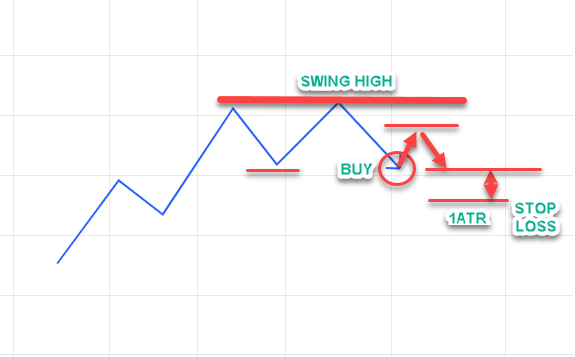
But what I will do now is that my first target from this swing high will now be shifted to this swing high over here.
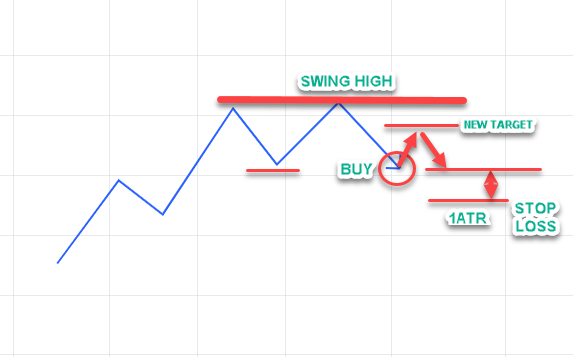
The market can now reverse up higher into the swing high; I will then exit half my position at this swing high.
In a way, I have brought down my first target to the most recent swing high.
The market can now reverse up higher into the swing high; I will then exit half my position at this swing high.
In a way, I have brought down my first target to the most recent swing high.
I have a question about stop-loss using ATR; if the higher timeframe (daily) is trending up, and I go down to the lower timeframe (H4) for entry, which ATR do I refer to?
If you're entering your trade, let's say on a four-hour time frame, then I recommend just using the ATR value from the four-hour timeframe since that's the timeframe you are using to time your entry.
Do you have a discount code for the trading view?
I don't have any discount code for trading view here. From what I know, they don't give any discount code. The only thing I know is that they tend to have a slightly better deal during Black Friday compared to any time of the year.
What broker do you use?
My forex broker is CMC, and my stockbroker is the interactive brokers.
Do you analyze your past trades based on setups?
Yes, I analyze it based on a trading setup, whether it's a false break or trend continuation trade, whether it's a breakout.
Could you recommend a broker and a platform? I'm tempted to go for the trading view as I do my testing and learning there, but I noticed that most brokers work with MT4/MT5, not trading view?
For the broker, I recommend if you trade stocks, you can look at interactive broke and TD Ameritrade.
If you want to look at forex, you can look at CMC.
You mentioned about 80 candles to estimate range or accumulation. Can I use the Donchian channel?
If you use a Donchian channel, it will identify the highs and lows right over the last 80 days. I'm not sure if that will be too relevant because the critical thing we are looking for is for the market to be in a range of at least 80 candles.
Do you prefer to use indicators like RSI and MACD or to keep it clean?
If you look at the UPAT, I use mainly price action, moving average, and average true range; that's pretty much it.
I don't use RSI and MACD.
I have YouTube videos on RSI MACD, but it's just mainly for educational purposes. For people interested in learning more about those indicators and how they work, so that's was my purpose.
In the pro trader's edge, when the market is in an uptrend, how do we know that the uptrend is over to delete them from the watch list?
When I look at a trend, I want to see that the price is above the 100-period moving average.
If it breaks and closes below the 100- period moving average, probably that's not a trend I want to be in because they are likely to be other more beautiful trends to trade.
I would likely remove the stock from my watchlist.
This is a general guideline that you can use to figure out the trend.
You have a $10,000 account, and you risk 1% on each trade. So that's about $100 on each trade. Do you adjust when the account has grown decently? Or do you change every time you make a profit loss?
To make my life easier. I don't adjust it after every trade. I only adjust it when I have made a decent amount or when adding funds. If I have $10,000, I will change it when my account gets to $15,000.
Interactive brokers are upon opening a position; how do I see the open positions to check the P&L?
This is a very technical question, and usually, I don't answer questions on brokerage because the broker is the one that can help you best.
How do I improve the quality of trade selection? I find that I always choose the wrong trade and loss quite a lot. What should I focus on when I do self-study?
My suggestion is to trade in the direction of the trend and trade from an area of value. You wait for a good entry trigger like the hammer or bullish engulfing pattern.
Have a reasonable stop loss, and your stop loss should Ideally go a distance below your area of value.
Set a target just before the most recent swing high. This should improve the quality of your trade once you are trading from an area of value and in the direction of the trend.
Do me a favor; even if the market is ranging and it's at resistance, don't take the trade yet instead, focus on trending markets.
Do a review on the EURJPY daily timeframe.
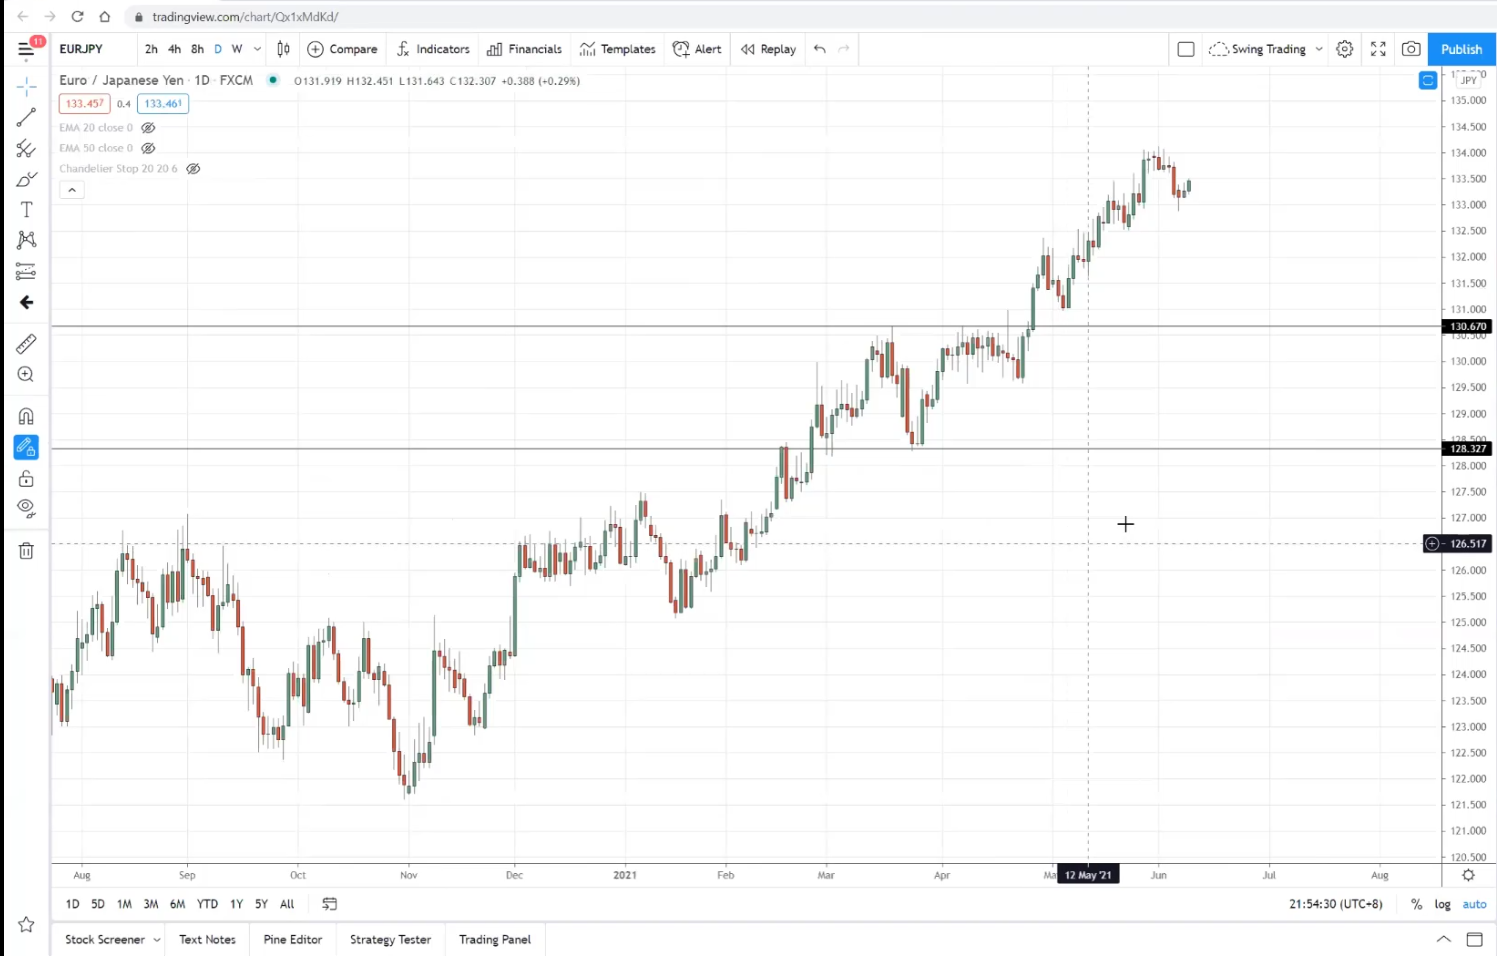
To me, it's an excellent trending market I would say is a strong uptrend. If I overlay the 20MA, the prices are above the 20MA
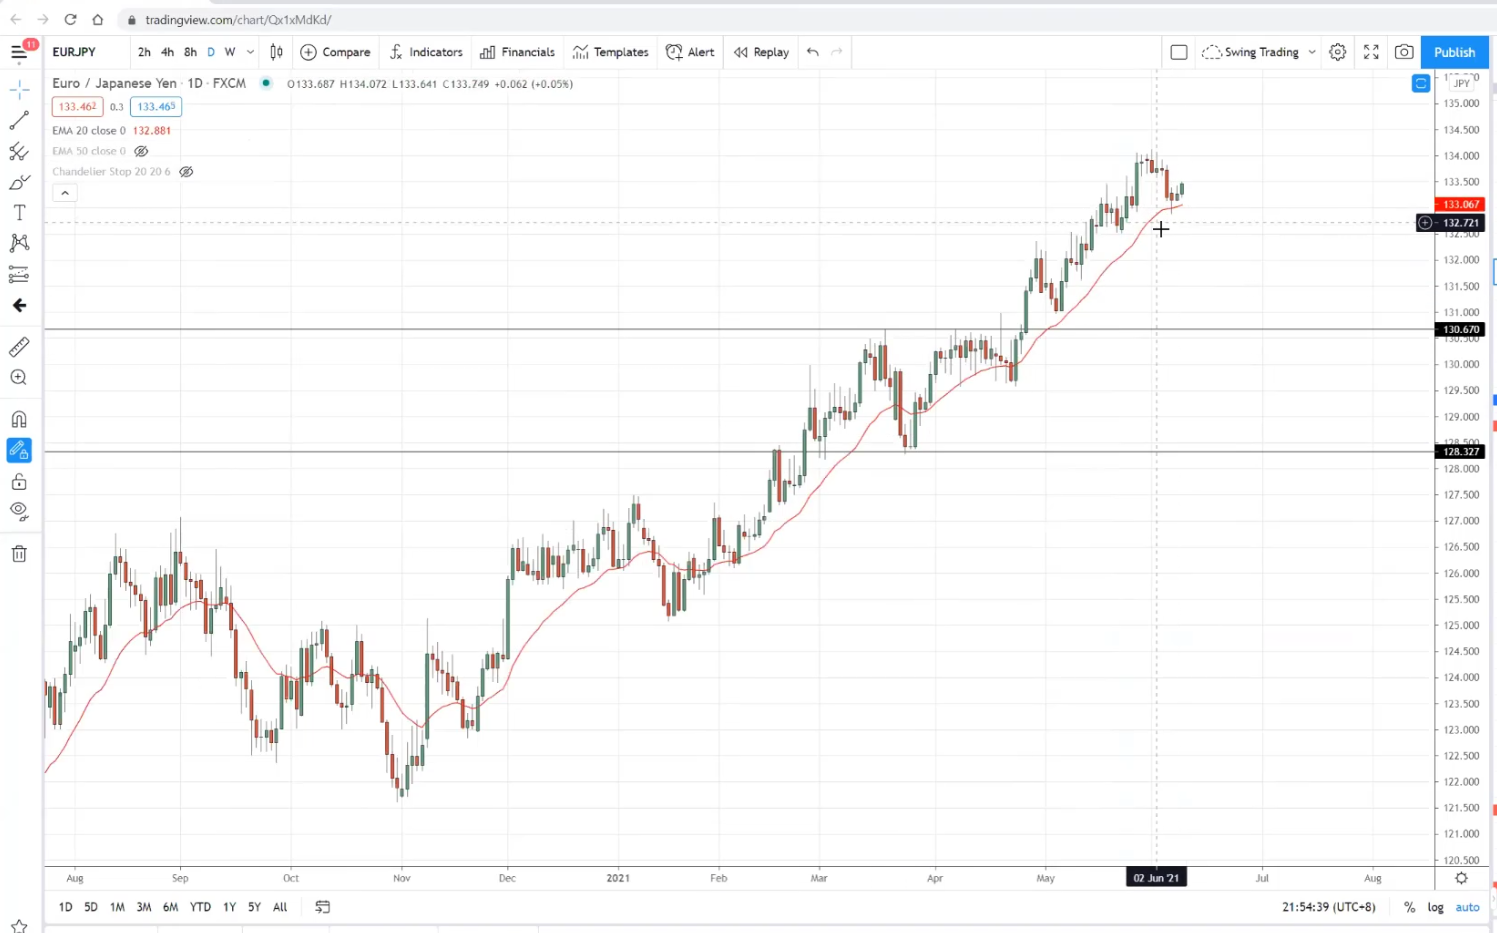
Usually, the daily timeframe can challenge your entry for solid trending markets because the pullback is generally relatively shallow.
I want to go down to a lower timeframe like the eight-hour time frame to time my entry.
I would say the area of value on this timeframe maybe around the 132.50 level somewhere here.
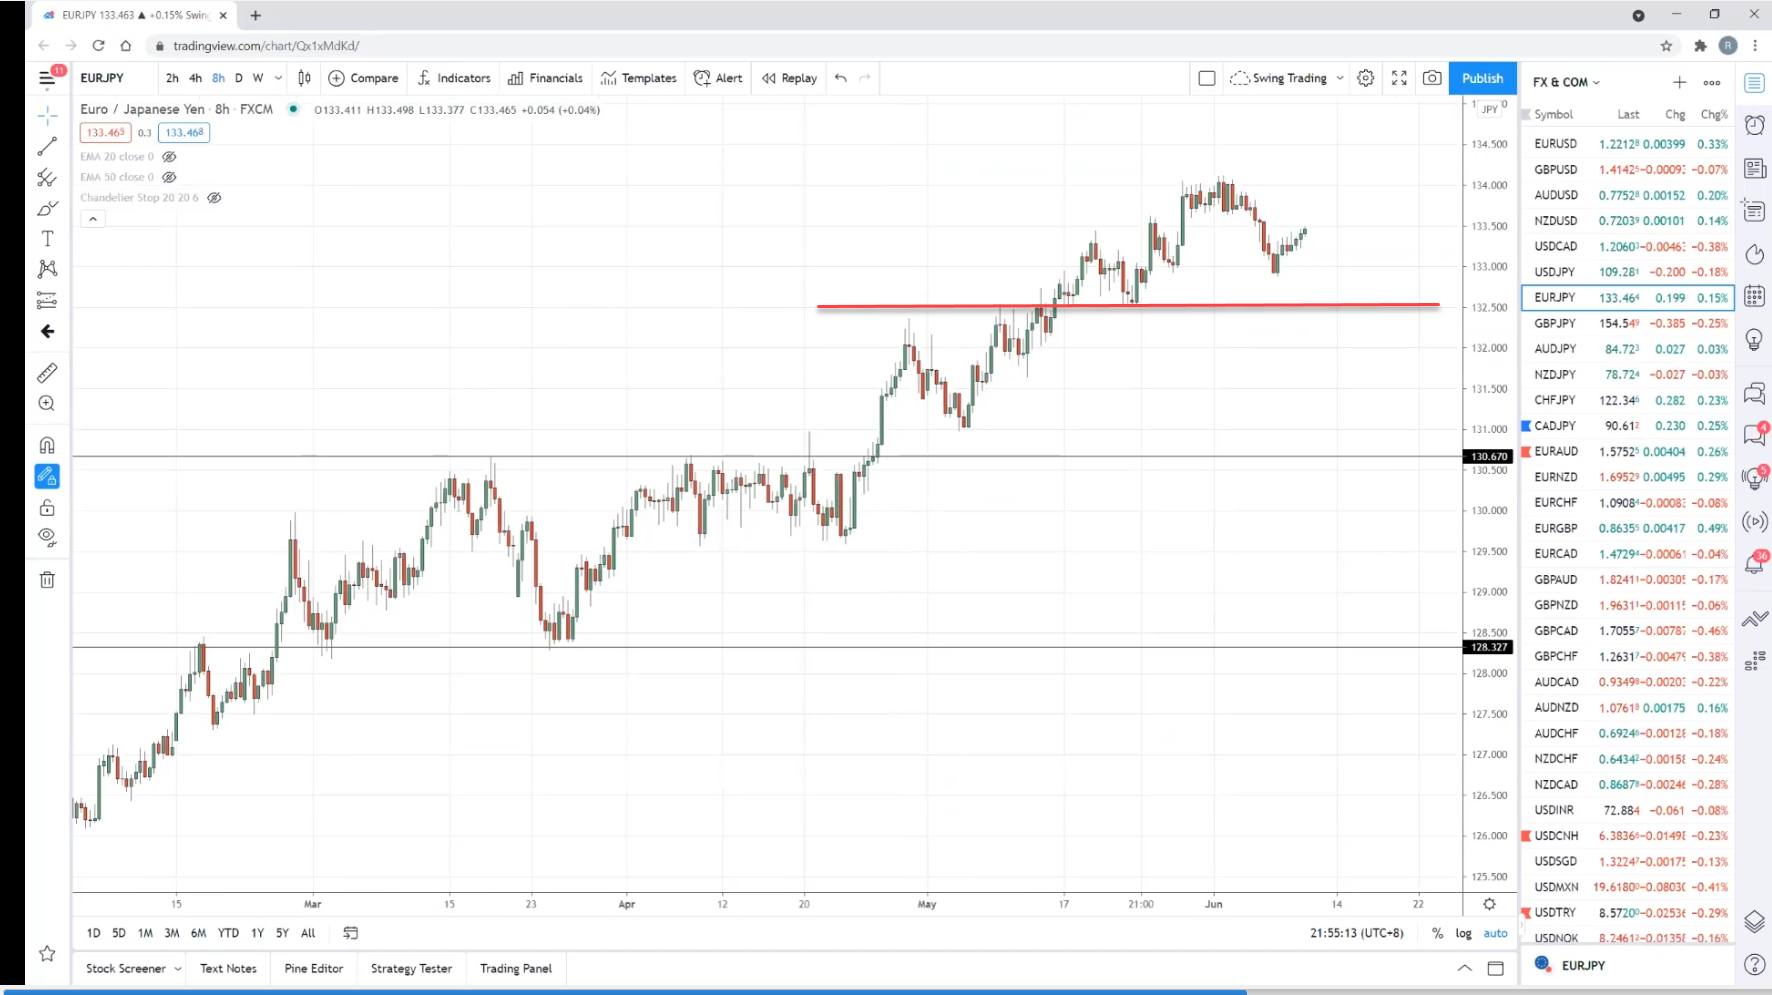
You can look for a potential setup around the 132.50 level.
My take right now is the market is bullish. But of course, when I identify the area of value, it doesn't mean that the price comes to this area of value; I will trade it.
Because sometimes, I might get a better trading opportunity on other currency pairs, and I might choose the different currency pairs.
Trading in an area of value is one thing, but when you get multiple trading setups, you always choose to pick the trading setup.
Do you exit current positions before taking on a new position? How many positions are you usually in?
This depends on my stock discretionary stock trading account; I usually have not more than eight positions.
For some systematic strategies like the systematic trend-following could be up to like 40 or 40 plus positions is possible as well also generally depends on the system but primarily for price action trading strategies for discretionary trading strategies. I have no more than eight positions.
How do you handle the up and down in a trade?
The thing about stock markets is that the market could get up higher and lower. To me, it's the cost of doing business; if it goes against you and didn't trigger a stop loss, then I will quickly bail out of the trade to prevent further damage.
Is the UPAT course more for forex or individual stocks?
The ultimate price action trader is a course for discretionary traders to apply the concepts on almost any market and any timeframe.
You can apply the concepts in any markets, crypto markets, indices, as long as the markets you are trading have enough liquidity and volume.
You will see many examples in the UPAT course regarding forex to commodities and stocks; that's what Rayner trades when making those videos.
The Ultimate System trader (UST) is a systematic trading course. If you want to use a strategy that's already proven and backtested or has survived a couple of financial crashes, then the UST is for you.