When drawing trendlines or support and resistance do we focus on the bodies or wicks?
The key thing that I focus on is to get as many touches as possible. If I could get a trendline that touches both the bodies and the wicks 5 times, perhaps 3 times on the bodies while 2 times on the wicks, then I will draw that trendline.
Hey Rayner, sometimes if you’re waiting for the price to reach day support and get strongly rejected, but before it reaches it, the price just reverses. My first question is, is this just part of the trading process and things like that happen and so you forgo this trade? My second question is, do you think this could be a result of me drawing an “inaccurate” support line.
Yes, it’s part and parcel of trading.
Remember, support and resistance are areas of value on your chart. You’ve no idea the price will get rejected at the earlier part of the area or at the later part of the area. This is something that is expected.
If you’re not getting the setups you want, you should move on and find something else to trade, be it FX, commodities, or stocks, etc. Expand the markets that you’re watching, and you won’t have this issue of, “Oh man, the market has moved without me.”
What is the reason you trade using naked charts only with support resistance and candlestick pattern without using any other indicators? Do indicators confuse you?
I use moving average to trail my stop loss, identify the trend, and identify the area of value.
I use the ATR indicator to help me set my stop loss, but they are secondary.
Considering that UPAT is quite discretionary, there are multiple levels of support and resistance. There are major and minor levels. Within a major support resistance area, you could draw say another minor one inside. And say if I were looking to enter a trade, I am unsure whether to wait for it to retest the major or minor support resistance. Sometimes I wait for the major level but it reverses at the minor level. On the other hand, there is the fear of entering "too early" since it’s a minor level. How do you grapple with this situation?
If you check out my weekly charts, you’ll realise that I only draw the major levels as I primarily trade on the daily timeframe, while the weekly timeframe is my higher timeframe.
For me, the black lines are for the daily timeframe, while the red lines are for the weekly timeframe.
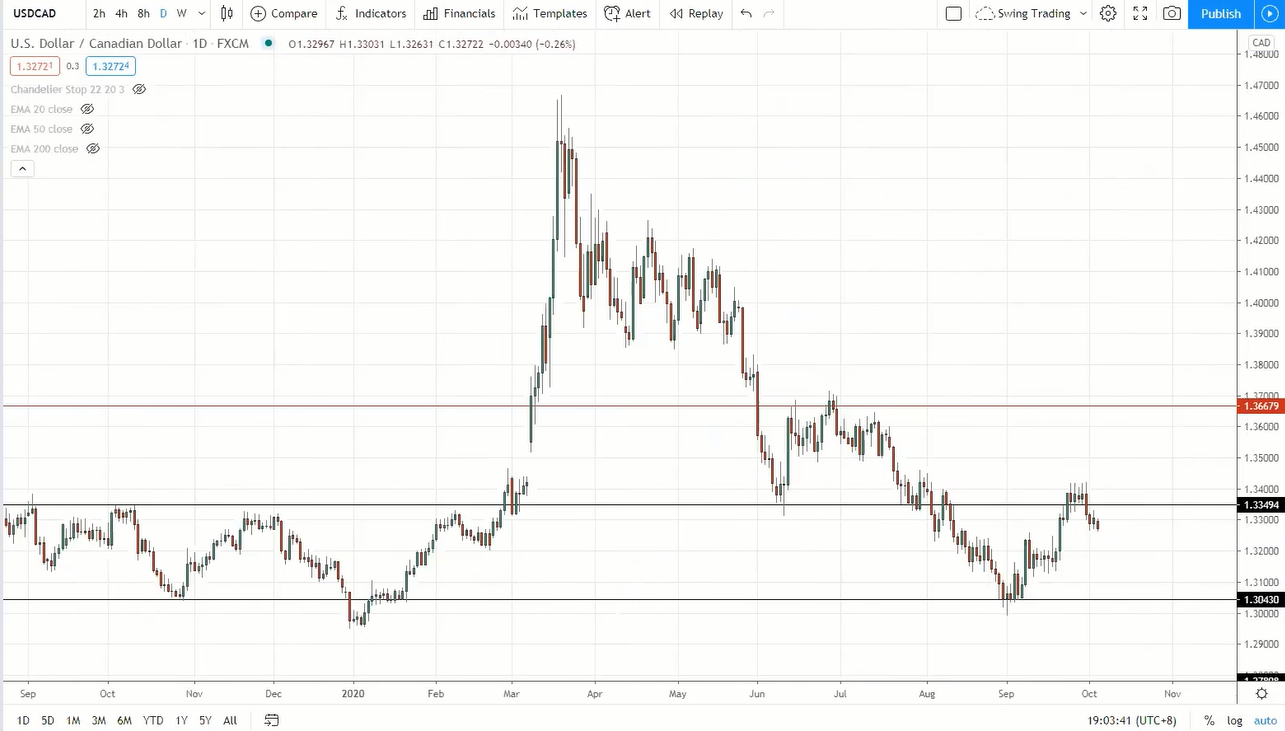
So you can see that I pretty much ignore all the other minor levels in between.
How I grapple with the situation is that I’ll wait for the price to come to the level that I’ve drawn, the black and red areas on my chart. If it doesn’t reach those levels and bounce away instead, I’ll just accept that and move on.
Because I trade a lot of markets, including FX, commodities, stocks. So the fear of missing out is almost non-existent for me because I trade multiple trading strategies across several markets and there are always trading opportunities for me.
I prefer to trade off major levels because the reaction tends to be larger, the bounce off these key support resistance levels tends to be stronger with a greater profit potential as well.
Also, it’s not that you can’t trade off the minor levels, but those levels are more significant for the shorter-term traders who are trading on the 15-minutes timeframe as their stop losses and targets are smaller. If there’s a potential 50 to 100 pips movement, that could be 1:2 or 1:3 risk-to-reward trades.
But if you’re someone who’s trading off the daily timeframe where the stops are much larger, 150 to 200 pips, are probably insignificant profit potential to make it worth your while.
Are gaps support and resistance?
I don’t treat the gap as support and resistance. Instead, I’ll look to the left of the chart and see if there were previous highs or resistance that could act as support.
I simply imagine gap as a big bullish candle, and so a gap on its own is not an area of value to me.
However, some traders see the low of the gap as a support, but I don’t do that. Also because the setups I trade don’t require gaps at all.
What’s the difference between trending markets and ranging markets?
Trending markets have higher highs and higher lows, while range markets the price is bounded by the highs and lows like support and resistance.
If I trade on the 5-minute timeframe, should I look at the 30-minute timeframe as my higher timeframe?
Yes, because you’ll be using a factor 4 to 6 to identify your higher timeframe.
You can plot your support and resistance on the 5-minute and 30-minute timeframe to get your area of value. But clearly, the area of value on the 30-minute timeframe is going to be more significant and will lead to a stronger reaction in the price.
As per your video, when in doubt, check the higher timeframe for the structure of the market. What I want to understand is what if the weekly timeframe is down over long term but making higher lows and higher highs recently. Shall I regard market structure down or up?
Let’s say you’re entering on the daily timeframe and the weekly timeframe is your higher timeframe. If your daily timeframe is up, but the weekly timeframe is down, you can either skip the trade or just capture one swing and exit the trade at the nearest swing high or resistance.
If I trade on the 4-hour and use the daily as my higher timeframe, where should I follow the rule of trading with the trend? Should it be on both timeframe or should I only refer to the 4-hour trend?
It depends, but I generally like to trade when both timeframes are in line.
But sometimes, if that’s not possible, for example, if 4-hour is in an uptrend, and the daily timeframe is in a downtrend.
There are 2 things you can do.
First, you can skip and move onto something else
Alternatively, if you want to take the trade on the 4-hour timeframe, then I recommend just capturing a swing and not riding the move for too long because you’re trading against the higher timeframe trend.
If we choose a different timeframe of candlestick chart, the types of trend and type of moves can also be changed accordingly. Which timeframe do you think is best to correctly figure the market structure for gold futures trading?
It depends on your trading timeframe and how long you want to hold your trades. For me, I trade on the daily timeframe, while the weekly timeframe is my higher timeframe.
But whatever I trade, the key areas are based on my daily timeframe. But for my entry timeframe, it could be the 4-hour, 8-hour, or daily timeframe.
Sometimes the market reverses sharply from a declining stage to an advancing stage without going through the accumulation stage. What's the fastest and easiest way to identify the current stage in such confusing setups?
The market structure is simply a way to allow you to make sense of the randomness in the price action of the market, to give you a framework as to whether you should be buying or selling.
Of course, not all markets are going to respect the 4 stages of the markets. Sometimes, it could be in a downtrend and then the market does a V-shaped recovery upwards.
What I’ll do is, if it’s not clear, if it’s not making sense, then leave that market and move onto something that makes sense for you.
How do we know if the market is making a pullback or it’s making a reversal altogether?
When the market starts a new uptrend, ask yourself if that’s leaning against a higher timeframe structure like support. If it is, then I’ll be more convinced that the reversal is real.
But if it’s just a random strong rally out of nowhere, then I won’t even trade that. I’ll move onto something that makes sense to me.
So that’s the beauty of trading many markets – there is always something for you out there. You don’t have to force a trade if it’s not a setup you want. If something doesn’t make sense for you, then move on to trade something more obvious for you.
Trading is not about forcing a trade for every chart that you see. It’s about being selective and trading the markets that you understand, are comfortable with, and something that has an edge.
Please give a definition and explanation of what you mean with an area of value.
Area of value simply means, where potential buying and selling pressure could come in. An example could be an area of support where potential buying pressure could come in to push price higher.
It could also be a swing high, swing low, trendlines, trend channels, or even moving averages. If the price bounced off the 50 MA twice or thrice, then that moving average is an area of value where potential buying pressure could come in.
Is price action more important than an indicator?
Price action helps you identify the trend, identify an area of value, serve as entry triggers. Indicators they also have their place and can be used for setting a stop loss or managing your trade.
But primarily, my analysis on the market is always based on price action first, then indicators second.
Very often entry triggers (for example strong price rejections) cover a very large portion of the price move. So price rejection itself would bring a nice amount of profits. Are there any alternatives such that you're in a trade before the price rejection, so the rejection candle itself would start to bring in profits?
Yes, I have a mean-reverting strategy where I buy on the dips without confirmation candlestick patterns. It’s a systematic trading strategy that I trade.
If you want to learn more about it, the website is pullbackstocktradingsystem.com, you can have a look at it and learn more about this trading approach.
Do you have any guidance for understanding and trading 1) rising/falling wedges and 2) megaphone patterns? How to understand and exploit these specific patterns which were not covered in UPAT? I could trawl the net for explanations but would prefer to get the Rayner/UPAT approach to keep my methodology consistent.
There will be some techniques or tools that I’ve not covered in UPAT and the reason is simply because I created the UPAT to share with you the essence of price action trading.
Personally, I don’t trade the falling or rising wedges so I don’t want to include something that I don’t use. You can explore these patterns on your own, but I find that they are not essential in becoming a proficient price action trader.
Price action patterns that I primarily trade on are things like buildup prior to a breakout, ascending triangle, descending triangle, bull flag patterns and even the head & shoulders pattern.
Can you demonstrate ideal entry points at areas of value on the daily charts? I’m particularly interested in the setups you’re looking for and what determines your decision to place the trade?
You can check out our weekly market analysis, where every single week I’ll fire off a video that explains my thought process on each trade – when, why, how, entries, exits, stops, and targets, etc.
It’s under the Pro Traders’ Edge section, it’s under the icon under Weekly Trader Alerts.
Do gaps in the market represent a trading opportunity? I've seen a lot of gaps (pre-market) in the US market, specifically in NYSE and NASDAQ, which are the ones I've been studying for UPAT. How can we take advantage of this sometimes huge movement of stocks prices (gainers and loser)?
To clarify, the reason why we see gaps in the stock market is because the market opened at a much higher price compared to the previous day’s closing price. So in a way, you can imagine a gap as a big bullish candle itself, which broke out of the previous day’s closing price.
And the reason why the price gapped up higher is because there’s huge buying pressure that caused the market to open at a much higher price.
Assuming you're trading on an 8-hour time frame, and I'm waiting for a strong rejection candle, but it doesn't appear and hence I don’t enter. So do you then wait for multiple rejection candles to appear then enter? For instance, on the 8-hour timeframe, 3 bearish candles appear back to back to back (but these candles are not 1.5 ATR) but on the daily timeframe, it will appear as a huge rejection candle. But since I know that it is best to stick to trading in 1 timeframe (8-hour in this case) to get consistency in your results, I don't plan to enter on the daily timeframe and thus potentially miss a trade. What should my thought process here be?
Personally, I enter my trades on the 4-hour, 8-hour and even the daily timeframe, so I don’t really face that problem that you’re facing.
So what you can do is that, if you see a valid setup on the daily timeframe, and the risk-to-reward is justified, then you can simply trade it off the daily timeframe.
But at the same time, the price level that you’re looking at on the 8-hour timeframe has to be significant on the daily timeframe as well.
Alternatively, if you’re not able to find the trading setup on let’s say the daily timeframe, you could go down to a lower timeframe like the 4-hour timeframe to look for a break of structure once the price comes into an area of value on the daily timeframe.
If the stock broke out of resistance and I am waiting to enter on a pullback, but the price is down at the moment, when should I enter the trade?
You can wait for a retest at the previous resistance that could become support and look for a bullish reversal pattern to go long.
Alternatively, the stock could form a bull flag pattern when the 20 MA catches up with the price, and you can trade the breakout of the bull flag pattern.
What's your trading plan?
Identify the market structure, trade from an area of value, have a valid entry trigger, have a proper stop loss and reasonable profit target, and I trade a breakout with a buildup.
So basically, everything that I’ve covered in the UPAT is my trading plan. At least from a discretionary trading point of view.
Do we use the false break as the setup and the indicator turning up from oversold as the indicator? Or the indicator turning up as the setup and the bullish candle that completes false break as the trigger?
You can check out my webinar on YouTube – The Ultimate Trading Indicators Course (4 Powerful Trading Techniques) to learn more on how to properly utilize indicators in your trading.
Hi Rayner, hope you're well. Do you believe price action and indicators are not mutually exclusive and they can complement each other?
Yes, of course, this is what I do. I use moving average to identify my area of value, and I use the ATR indicator to help me set my stop loss. But the main thing is that the indicators shouldn’t be the primary basis for making your trading decisions.
The basis of your trading decisions (when to buy and sell) should be price action – defining the trend, identifying the area of value and entry trigger.
But when it comes to trade management or riding trends, this is where indicators can come into play to complement price action. You can use moving average to ride the trends by trailing your stop loss. The ATR indicator can help you set a proper stop loss, like 1 ATR below support.
Hi Rayner, I'm trading stock right now. I'm currently adopting to buy high and sell higher. However I am confused, sometimes when I look at the chart, it seems to be a breakout (without buildup) and the chart seems to be respecting the moving average. How do you approach this? Wait for it to touch the moving average or just ride on the breakout?
If the price has broken out and was respecting the moving average previously, then I will wait for a retest of the moving average, then look for long opportunities like a price rejection at the moving average.
Alternatively, you could wait for the price to retest previous resistance turned support. So I wouldn’t buy the breakout without a buildup.
I would rather let it come to a valid area of value first and wait for a valid entry trigger to go long.
Should we ignore all fundamental news at all or are there any particularly important and major news that we should follow (e.g. Non-farm payroll, unemployment claims, etc.) in making our trading decisions?
I’ll be honest, I ignore every single fundamental news out there.
Mainly because I trade on the higher timeframe, so my stop losses are usually large enough to accommodate any short-term news swings in the market.
However, if you trade on the 5-minute or the 15-minute timeframe, then you can’t really ignore the news, because you might get stopped out on a spike.
For short term traders, yes you want to be aware of news release like non-farm payroll, etc., so that you can consider exiting your positions before the news release it out as there could be huge slippages and spikes during those periods.
Are there any particular skills required to trade gold?
You can definitely trade gold using the price action methodology, depending on whether you’re a day trader or a swing trader.
How can you find the right stock trading setup of thousands of stocks out there? Do you use Thinkorswim to filter what stock that has the highest ROC, then find the trading setup?
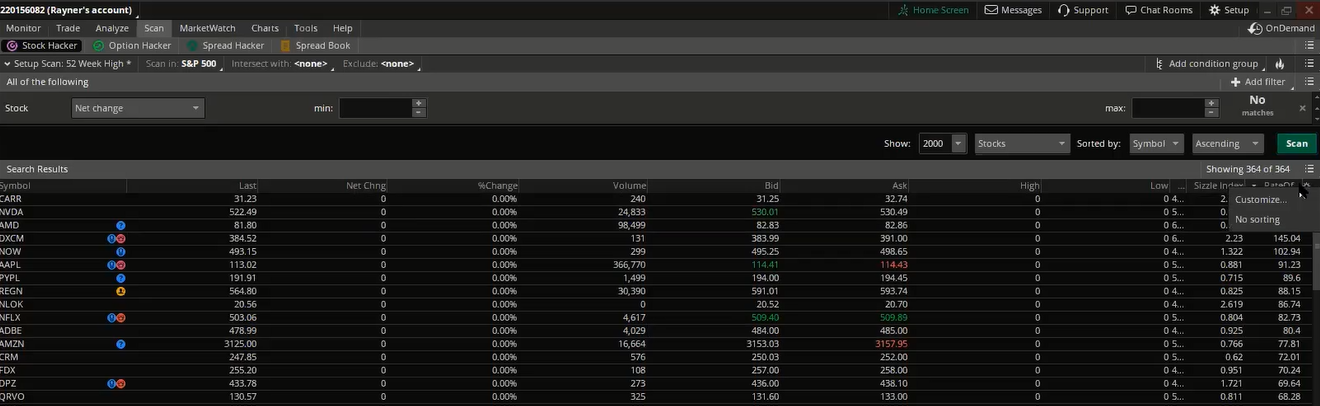
So what I’ll do is to head over to Thinkorswim’s Scan tab and choose the stock market that you want to perform the scan on.
Then click on the settings cogwheel at the right side:
Click Customise and you’ll see this window:
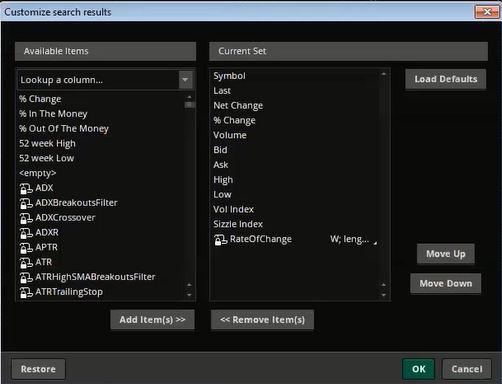
Search for the Rate of Change indicator and click Add Items(s). These are the settings that I use:
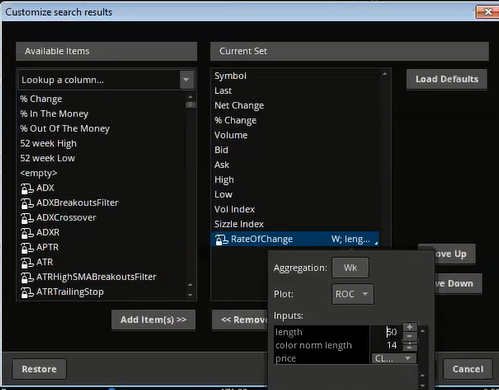
This will measure the Rate of Change in price over the last 50 weeks. Hit OK and click Scan. Now the scanner will rank the stocks according to their Rate of Change. So this is how you’ll find out the relative strength of the stocks easily.
Next, how do you find valid trading setups?
What I like to do is to look at the top 30 stocks manually and see if there are any valid trading setups that I can trade from. You could be looking for a false break at an area of value, etc., to time your entries.
Do you help traders in preparing their trading plans?
Yes, we have a module in the UPAT course that shares more about a trading plan. But if that’s not sufficient, you can reach out to your coach@tradingwithrayner.com and one of us will assist you to review your trading plan, to see how we can make it suitable for you.
I like to trade divergence, but I’m not sure how to measure the size of the reversal from that divergence.
I don’t personally trade divergence. But if you want to trade divergence, align it with the area of value like support.
You’ll have absolutely no idea on how big of a move the reversal will be, whether it will be a small pullback or a huge reversal. My suggestion is that if you want to trade divergence, and you’re long, your possible profit target could be at the nearest swing high or resistance.
Can you define the short, medium and long term trend? What’s the ATR multiple to use for each of those types of trends?
It’s relative because it depends on the timeframe you’re trading on. For some people, a long-term trend could be a few years, for some, it could just be for a few months.
2 ATR is typically for short term trend but take note that a 2 ATR on the daily timeframe is going to be very different from 2 ATR on the 5-minutes timeframe.
Then 4 ATR is for the medium term, and anything above 6 ATR is for the longer-term trend?
What’s usually the risk-to-reward that you’re looking for in your trades?
I usually look for a trade that’s with a minimum of 1:1 risk-to-reward in FX and commodities markets.
But for stocks, I usually look to ride the trend, because I am already buying the strongest stocks out there. I want to ride the trend for all it’s worth, instead of grabbing a 1:1 risk-to-reward.
If you’re trying to ride the trend, then have a trailing stop loss to ride the trend and wait for the trade to play out.
If you’re trying to capture just one swing, then just have a profit target to capture that one swing.
If the stock isn’t going anywhere, then have a time stop to get out if that swing doesn’t play out. Or if the broader market, like the S&P 500 has rallied 2% but your stock is only moving 0.1%, then I will exit the trade. Because clearly, that stock isn’t going to move much.
How long do you usually hold your positions? Sometimes the stock moves pretty slowly.
It depends on the trading strategy and timeframe I’m trading.
When I trade stocks. I have a trading strategy where my trades last for a few days, and I also have a longer-term strategy where I can be holding for months. So it really depends.
Yes, sometimes the stocks can move up and down slowly, so I primarily focus on the strongest stocks out there, by ranking the stocks according to the rate of change.
What's considered a small stop loss? Would it be less than 100, 500 or 1,000 pips?
This is relative, because if you trade pairs like EUR/USD, USD/CAD, 100 pips or 500 pips stop loss might be large. If you trade a pair like USD/ZAR or USD/NOK, then 500 pips or 1,000 pips could be nothing.
How many pairs of open positions should we have at the moment, assuming that we risk 1% per trade?
It depends on the markets you trade, if you trade many markets like commodities, FX, and stocks, then it’s possible that you have 8 to 10 open positions at one time.
How many correlated pairs should we have at a time maximum?
For a discretionary trader, I would say not more than 2 correlated pairs. So let’s say I’m trading AUD/JPY and AUD/USD, that’s my maximum exposure to AUD.
I want to become a better mean reversion trade, can you suggest a simple, reliable setup for mean reversion trading in a downtrend using price action and indicators? If I wanted to read up more mean reversion trading, which author/s do you recommend for trading in today's markets?
I’ve got this book called the Pullback Stock Trading System, it’s a mean reversion trading system for the stock market, and it’s only for the long side, where you only buy but you don’t short.
If you’re comfortable trading long-only in the stock markets, then that’s something you can check out.
It’s priced at USD9.90, and you can find out more on pullbackstocktradingsystem.com.
Also, you can check out the works of Larry Connors and Cezar Alvarez. Most of their work is on mean reversion trading in the stock markets, so you can also search them up on Amazon.
Chart pattern and Currency Strength Meter – which comes first and which is prioritized in making our trading decision (assuming that they do not align)?
The Currency Strength Meter is just a gauge for us to identify what’s strong and what’s weak.
If there’s conflicting information, I’ll look at the overall trend of the market, identify the area of value, entry triggers, stops and targets. These will be more important.
Recently, I’ve found out that the 15-week ROC and 5-week ROC give contradicting and conflicting signals. On the 15-week ROC, GBP and AUD are the strongest currency, whereas, on the 5-week ROC, GBP and AUD are the weakest.
Does this mean that the market is volatile/uncertain and we should avoid trading these pairs?
Firstly, I use the Currency Strength Meter to get a sentiment in the FX market, to know what is strong and what is weak in the last 15 weeks or the last 5 weeks.
The ROC is like the moving average, where the 15 MA and 5 MA don’t always align. Sometimes they can contradict, where the 15 MA can be in an uptrend, while the 5 MA can be in a downtrend, vice versa.
So if the 15-week and 5-week ROC diverge or show me a conflicting signal, then I will ignore the ROC or the Currency Strength Meter.
I simply trade using the price action methodology, the M.A.E.E. formula, that you’re familiar with:
- Market structure – if the market is in an uptrend, I’ll look for buying opportunities
- Area of value
- Entry trigger – it could be a reversal candlestick pattern, false break setup, or break of structure, etc.
- Exits – usually 1 ATR beyond the area of value, and the target depends on whether you want to capture a swing or ride a trend
However, if the ROCs are aligned, then I will use the Currency Strength Meter to zoom in to see what’s strong and what’s weak, to find the best pair to go long on the strongest pairs and short the weakest pair.
In your YouTube and UPAT examples, most of them are based on currencies. Can you demonstrate based on stocks?
Yes, in my future weekly market analysis videos, I will be covering more stock examples too.
But the setup is pretty similar, focusing on the strongest stocks out there, identifying the trend, finding an area of value, looking for setups like a false break or an ascending triangle or buildup before a breakout.
I am using IC market demo at the moment. I have been following your video and you mentioned that if you take a trade that’s worth $100, you can close the first $50 at the first swing high and hold the other $50 while letting the market runs higher. Can I do that in IC Market?
This is basically a scaling up technique, I believe you can do that on IC Market’s MT4 platform, but I’m not sure for their other platform.
But for these kinds of technical brokerages questions, it’s best to ask the brokerage directly. I’m probably not the best person to answer this.
What are the differences between the strategies you provide free on YouTube and the ones in UPAT?
On my YouTube channel, yes there are some overlapping materials. But in the Ultimate Price Action Trader (UPAT), everything is very structured, done step-by-step. And that’s the key thing that you’re investing in.
It’s like going to school to learn mathematics where you have a teacher to guide you along every step of the way.
In the UPAT, you’ll also get a coach to help you with any questions that you might have, and also give you assignments to do, provide you with tools, resources, and group coaching sessions.
So that’s the key difference.
From my broker, besides the S3, S2, S1 and R1, R2, R3 information, every day I also get information of Pivot Point. Could you explain the meaning of this information and why it is not mentioned in the UPAT course?
For those who are not aware, S1, S2, S3 and R1, R2, R3 are the Pivot Points on the charts for the timeframe that you’re looking at.
The UPAT course focuses primarily on price action. This is not a course on technical analysis 101. If you’re looking for broad technical knowledge, Investopedia and the other trading websites will give you a very good overview of these tools are.
But the reason why you invested in the UPAT is because you want to know the shortcut that you can focus on when it comes to price action trading.
So there is a lot of information which I didn’t include in the UPAT because those information are not needed for you to be a proficient price action trader. I’ve only shared stuff that has worked for me, and I believe they will work for you as well.
This will help you to focus on your learning. After which, if you want to explore other materials, feel free to do so.
But to be proficient in price action trading, I find that Pivot Points are not needed at all.
Can you further elaborate more on the "Big Banks" that control and manipulate the market? How should we avoid them?
I don’t personally know anyone who works in a bank and trade the banks' money. From what I know, most of the bank dealers help facilitate liquidity in the markets.
For example, if a particular hedge fund wants to buy $X amount of EUR/USD, then they’ll help to facilitate the transaction.
What do you recommend after the UPAT course? Is there any advanced UPAT course after this?
In terms of price action trading, the UPAT is the only course I have. I don’t have different levels of price action trading course. Everything that I know of price action trading is in the UPAT course.
If you have a strong foundation in the price action trading through the UPAT course, then you’re pretty much good to go.
The highest level of price action trading is when we take into account the statistical behaviour of the markets. We have a module in the UPAT which shares more on the market behaviour, where I shared which market has a trending or mean-reverting behaviour.
So if you combine price action trading with the statistical behaviour of different currency pairs, that will really take your price action trading knowledge to the next level.
And when you trade stocks, focus on trading stocks with the highest ROC values over the last 50 weeks.
Is there a Discord community for the UPAT members?
No, we don’t have that. We tried that but it didn’t work out because my moderators and I are not active on Discord. It’s unlikely that we will be reopening that, and we will stick to using Facebook to answering your questions.
Can I apply the Pullback Stock Trading System to the Philippines stock?
I have not backtested the system on the Philippines stock market and I don’t know what the overall results will be. As much as I want to say you can trade the exact system, but I don’t have the data to tell you confidently what the exact result will be.
I don’t have access to Philippines stock market data and I only have US stock market’s data, which is more easily available.
Funny enough, I realized that whenever I buy a lot of shares at one point, it will trigger a breakout in the market. Should I split up my transactions so as to not affect the market directly?
I’ve no idea what’s the size of your trade and the types of stocks you’re trading.
But let’s say you’re trading the Russell 1000 stocks, which are the largest 1000 stocks in the US market, I don’t think your size will cause the share price to breakout. Perhaps that could happen for penny stocks.
How much overlap is there between the Pullback Stock Trading System and the UPAT?
There is no overlap at all. Because the Pullback Stock Trading System is systematic and not discretionary. Everything will be executed according to the rules.
(It’s not a course, it’s a 21-page trading booklet that explains the rule, results and how you can execute the trades.)
If I am trading the daily timeframe, what time is the best in Singapore to review my trades once per day?
It depends on what markets you’re trading, if you’re trading the FX market, what I do is I will review them once a week. Because on the daily timeframe, there aren’t a lot of trading opportunities every day. So I’ll do my review on the weekends when the markets are closed.
So if you’re trading on the daily timeframe, the weekends are a good time to plan and review your trades for the upcoming week as well.