
Download: Video | Transcript
Note: The origin of this trading strategy is called Dual Momentum by Gary Antonacci.
Hey hey, what's up my friends!
Welcome back!
In this video, you'll learn what I call the Monthly Momentum Trading System.
It’s a trading system that seeks to capture momentum across the bond and stock markets.
Why it works
Simply because:
- In the long run, stock markets tend to outperform the bond markets
- In the short run, the bond markets can outperform the stock markets
If you look over the last 80, 90 years, the returns of stocks have outperformed bonds.
However…
During crisis periods when there is fear in the market, money tends to channel into bond markets.
That's why you see a short-term uptrend in the bond markets, but a downtrend in the stock markets as people are all selling stocks.
If you can trade the right markets at the right time and if you know that now is a good time to be in bonds – you’ll long bonds and sell stocks.
Here’s the thing:
Over the long run, you can outperform the market by trading the right markets at the right time.
To give you a rough idea…
If it's a bull market, you want to buy stocks and not buy bonds.
But in a bear market, you want to sell your stocks and buy bonds.
By doing this right allocation mix at the right time, you can outperform the market in the long run.
Who it’s for
The Monthly Momentum Trading System is for you if:
- You want to capture momentum in the markets
- You can at least trade once per month
Alright?
Then let’s move on…
Download: Video | Transcript
In this video...
You'll learn the markets that we’ll be trading in the Monthly Momentum Trading System.
The Stocks ETFs You’ll Trade in Monthly Momentum Trading System
For stock markets:
- S&P 500 ETF (SPY)
- ACWI ex-US ETF (VEU)
These are Exchange Traded Funds (ETFs) that belong to the stock markets.
They represent a basket of stocks or sectors, and they can be traded like an individual stock on an exchange.
1. S&P 500 ETF (SPY)
You can’t buy the S&P 500 index…
But what you can do is to buy the S&P 500 ETF that tracks the returns of the index.
If you're going to do so, then you look for the symbol “SPY” which is the S&P 500 ETF.
2. ACWI ex-US ETF (VEU)
I know it looks like a handful, but it stands for All Countries World Index (excluding the U.S. stock market) ETF.
This gets you involved with the stock markets around the world, excluding the U.S. stock market.
It’s represented by its symbol called “VEU”.
The Bonds ETFs You’ll Trade in Monthly Momentum Trading System
For bond markets:
- Treasury Bills (BIL)
- Aggregate Bonds (BND)
1. Treasury Bills (BIL)
The Treasury Bills can be found as “BIL”, the ETF's symbol.
2. Aggregate Bonds (BND)
Aggregate Bonds can be tracked using “BND”, the ETF’s symbol.
It gives you exposure to the U.S. investment-grade bonds.
Its goal is to try and keep in pace with the U.S. bond market returns.
For these 4 ETFs, you can look them up on an exchange and trade them.
These are the 4 markets that we'll be trading in this Monthly Momentum Trading System.
Moving on to the next lesson…
In this video:
I’ll share with you what are the Monthly Momentum Trading System rules.
It might seem a little bit complex, but don’t worry.
I promise everything will be crystal clear by the end of it.
The MMT Rules You Must Follow
The rules are:
1. Is the S&P 500 returns over the last 12 months greater than ACWI ex-US?
2. If returns of S&P 500 > ACWI ex-US, then is the S&P 500 returns over the last 12 months greater than Treasury Bills?
a. If yes, then buy/hold the S&P 500.
b. If no, then buy/hold Aggregate Bonds.
3. If returns of S&P 500 < ACWI ex-US, then is ACWI ex-US returns greater than Treasury Bills?
a. If yes, then buy/hold ACWI ex-US.
b. If no, then buy/hold Aggregate Bonds.
4. Run the system on the first day of every month.
Or simply follow this flow chart:

I’ll explain each one of the rules…
1. Is the S&P 500 returns over the last 12 months greater than ACWI ex-US?
What we’re trying to do here is to compare the S&P 500 and ACWI ex-US.
ACWI ex-US is the stock market around the world, excluding the US stock market.
Here you want to find out which is the strongest stock market:
- Is it the US stock markets?
- Or stock markets around the world excluding the US stock market?
2. If returns of S&P 500 > ACWI ex-US, then is the S&P 500 returns over the last 12 months greater than Treasury Bills?
If yes, you buy/hold the S&P 500.
If no, you buy/hold Aggregate Bonds.
For this part, you’re trying to compare the stock market returns with the bond markets.
As you’ve seen earlier…
In good times, the stock markets tend to outperform the bond markets.
In bad times, like a recession or crisis period, the bond markets tend to outperform the stock markets.
So over here, you want to determine whether:
- The stock markets are outperforming the bond markets or
- The bond markets are outperforming the stock markets
3. If returns of S&P 500 < ACWI ex-US, then is ACWI ex-US returns greater than Treasury Bills?
If yes, then buy/hold ACWI ex-US.
If no, then buy/hold Aggregate Bonds.
Next…
4. We’ll run this system on the first day of every month
I typically run it on the first trading day of the month.
Lastly…
I hope this makes you understand how the system works and why you are buying certain markets or why you’re not buying certain markets.
Let’s move on to the next lesson.
Download: Video | Transcript
NOTE: For updated results, please check the portfolio tracker (updated once a month)
I want to share with you the monthly momentum trading system results.
This time around, I did the backtest from 2007 to 2017 because I only have the ETFs’ data as early as 2007.
I think most of these ETFs were not trading before 2007 yet, so I didn’t have data on it.
However…
I’ve gotten some results from third-party sources.
They didn’t use ETFs, but I think they used the index itself to do the backtesting work.
It went back to much earlier years – I’ll share with you those results later.
So first…
I want to share with you my own results based on the backtested data that I’ve used.
The MMT Results (2007 – 2017)
Here’s what it looks like:
- Number of trades: 128
- Winning rate: 67.97%
- Profit factor: 1.96
- Annual Return: 8.78%
- Max drawdown: 21.1%
With about 128 number of trades over 11 years, you’re getting about 11, 12 trades each year.
MMT Results (2007 – 2017): Monthly & Annual Returns
Let’s look at the month-on-month and year-on-year returns from 2007 until 2017:

There’s one losing year, which is in 2015.
For now…
Let’s move on and have a look at the results from 1971 to 2017.
MMT Results (1971 – 2017): Monthly & Annual Returns
The results I’m going to share with you is from a third-party source.
They have done their own backtesting work, and I want to share them right now.

You can see over here, these results over here are all from the third-party source.
I’ve made it very similar for you to look at.
Since 1971 until 2017, you can see that:
- There are a few losing years in between
- The long-term annual return since the 1970s is 17.43%
- With a maximum drawdown of 21.1%.
Here’s the thing:
I don’t like to trust third-party source without verifying it.
So…
Are their results reliable?
What I did was to use my own data and compare over the last 11 years – how did it fare and how similar it is to mine.
Here’s a direct comparison of our results from 2007 to 2017:

You can see that in 2007, we’ve some slight discrepancy.
This person had a 17.1% return, whereas I only had a 5.4%.
Then in 2008, he had a down year of -6.5%, whereas I made a profit of 6.4%.
After which, things are slowly getting better:
He had 11.6%, I got 7.1%.
He had 5.5%, I got 3.5%.
He had 0.7%, I had 0.1%.
He had 11.4%, I had 15.6%.
He had 31%, I had 29.3%.
He had 13.7%, I had 13.3%.
We both had a down year in 2015
Then after which, it’s all pretty similar.
Except for the first few years, most of our subsequent returns are somewhat similar and getting even more similar.
Thus, I can trust that their data from 1971 to 2006 is relatively accurate as well.
I won’t take it at face value as being 100% the same if I were to replicate it using ETFs.
But still, I would say this overall is a profitable trading strategy, and it clearly beats the markets.
Instead of an annual return of 17.43%, you might want to bring down a few percentage points to manage your long-term expectation of this strategy, perhaps annual returns of 14 or 15%.
The maximum drawdown of this data is 21%, the same as my own backtesting data.
So I would say it was measured pretty accurately.
Next, you’ll learn how to implement this Monthly Momentum Trading System.
Download: Video | Transcript
You can use Thinkorswim or Interactive Brokers to execute your trades.
Hey hey, what’s up, my friends?
In this video, I’ll share how you can execute this Monthly Momentum Trading System.
How to Execute the Strategy (Part 1)
You’ll need to:
- Get a broker that allows you to trade ETFs
- Head to www.etf.com
- Follow the Monthly Momentum Trading rules
I’ll explain…
1. Get a broker that allows you to trade ETFs
You’ll need a broker that allows you to trade Exchange-Traded Funds.
You can consider these brokers:
- Thinkorswim
- Interactive Brokers
You can check out my dedicated Resources Section for each strategy as well.
I’ll put in links to recommend brokers, the flow chart, the strategy, the additional websites and links that might interest you.
2. Head to www.etf.com
This is where you’ll check for the performance of the 4 ETFs that you’re supposed to trade.
3. Follow the Monthly Momentum Trading rules
I pretty much assume that you don’t even remember the rules.
But don’t worry.
This flow chart will help you:
Strategy Walkthrough
Let me walk you through an example:
Over here at www.etf.com, you can search for the SPY.
Scroll down and check its past one-year return:

The past one-year return for SPY is 20.69%.
Next…
Let’s assume that today it’s the 2nd of January, a brand-new year.
And you want to know which market you should be buying and holding – stocks or bonds.
Is the return of the S&P 500 greater than the ACWI ex-US?
Let’s check…
Now you’ll pull out the performance data of ACWI ex-US.
This time around you’ll look for VEU, the All-World excluding U.S. ETF:

You can see that the performance of this ETF for the past 1 year is only 5.57%.
So yes, the return of the S&P 500 is greater than ACWI.
Now you want to ask yourself…
Is the return of the S&P 500 greater than Treasury Bills?
Find out what’s the past one-year return (or the past 12 months return) of Treasury Bills (BIL).
Just type BIL in the search bar and hit enter.
You’ll be brought to the search results page, so just click the first search result.
It shares with you all the data of the BIL ETF:

Its past one-year return is 1.31%, which didn’t beat the S&P 500.
What should you do?
Just follow the flow chart:
Since the return of the S&P 500 is greater than the Treasury Bills…
You’ll buy and hold the S&P 500.
And you’re done for the month.
That’s it.
You’ll do this on the first trading day of next month and repeat this whole process again!
If you ask me, I think you can do this in two minutes.
What’s holding you back is your internet connection and how fast it loads this www.etf.com site.
That’s pretty much it and I’ll see you in the next lesson.
Download: Video | Transcript
Hey hey, what’s up my friends!
In this video, I want to explain to you step by step on how to execute The Monthly Momentum Trading System.
How to Execute the Strategy (Part 2)
There’re only 4 steps to it:
- Choose a date to rebalance every month
- Follow the rules
- Position size
- Execution
I’ll explain further…
1. Choose a date to rebalance every month
Let’s say you want to start on the 2nd of every month.
So, on the 2nd day of each month, you will rebalance this trading system.
You’ll also do it on the 2nd of January, 2nd of February, 2nd of March, etc.
2. Follow the rules
Here’s the flow chart that explains the rules:
Don’t worry about this flow chart, you can find this in the Resources Section.
And it will make your life easier.
3. Position size
I’ll show you how to do it step by step below.
I’ve also got a position sizing calculator in the Resources Section that you can use.
4. Execution
Lastly, how you’ll actually execute this particular trading system.
But don’t worry.
I’ll walk you through.
Strategy Walkthrough
Let’s suppose we’re going to rebalance on the 2nd day of every month.
But what happens if the 2nd day of that particular month is a weekend?
Well, then just do it on the next working day.
For example:
If 2nd of March is on a Sunday, then you’ll just do it on the 3rd of March which is a Monday.
So, you’ll choose the date to rebalance.
It’s a monthly trading system, and the rules are simple to follow over here:
Start here each month and ask:
Is the S&P 500 greater than the ACWI ex-US?
To find out, we’ll go to www.etf.com and find out what is the one-year return on the S&P 500.
The ticker symbol is SPY.
Just scroll down and you’ll see:

Its one-year return over here is 3.28%.
When we’re talking about one-year return, we’re looking at the return over the last 12 months!
Not the year-to-date return.
If now it’s April, year-to-date return tells you the returns from this January to April.
But one-year return tells you the returns from last year April to this year April.
See the difference?
So, the SPY’s one-year return is 3.28%.
Now…
Is this return greater than ACWI ex-US?
Its ticker symbol is VEU.
Refer to the earlier videos if you’re unsure.
I have actually shared with you the different ticker symbols for the different ETFs.
Here’s what it looks like:

VEU’s one-year return is -8.59%.
Clearly, the SPY has a greater return.
Following the flow chart…
Yes, the SPY or the S&P 500 is greater than this.
Now…
Is the S&P 500 greater than Treasury Bills?
Let’s check out the Treasury Bills, its ticker symbol is BIL.

You can see that the BIL’s one-year return is 1.82%, while the SPY is 3.82%.
Clearly, the S&P 500 is greater than Treasury Bill – so you’ll buy and hold the S&P 500.
But how do we do that?
Execution Walkthrough
You’ll log in to the trading or charting platform that you’re using.
I’m using the Thinkorswim charting platform in this lesson:
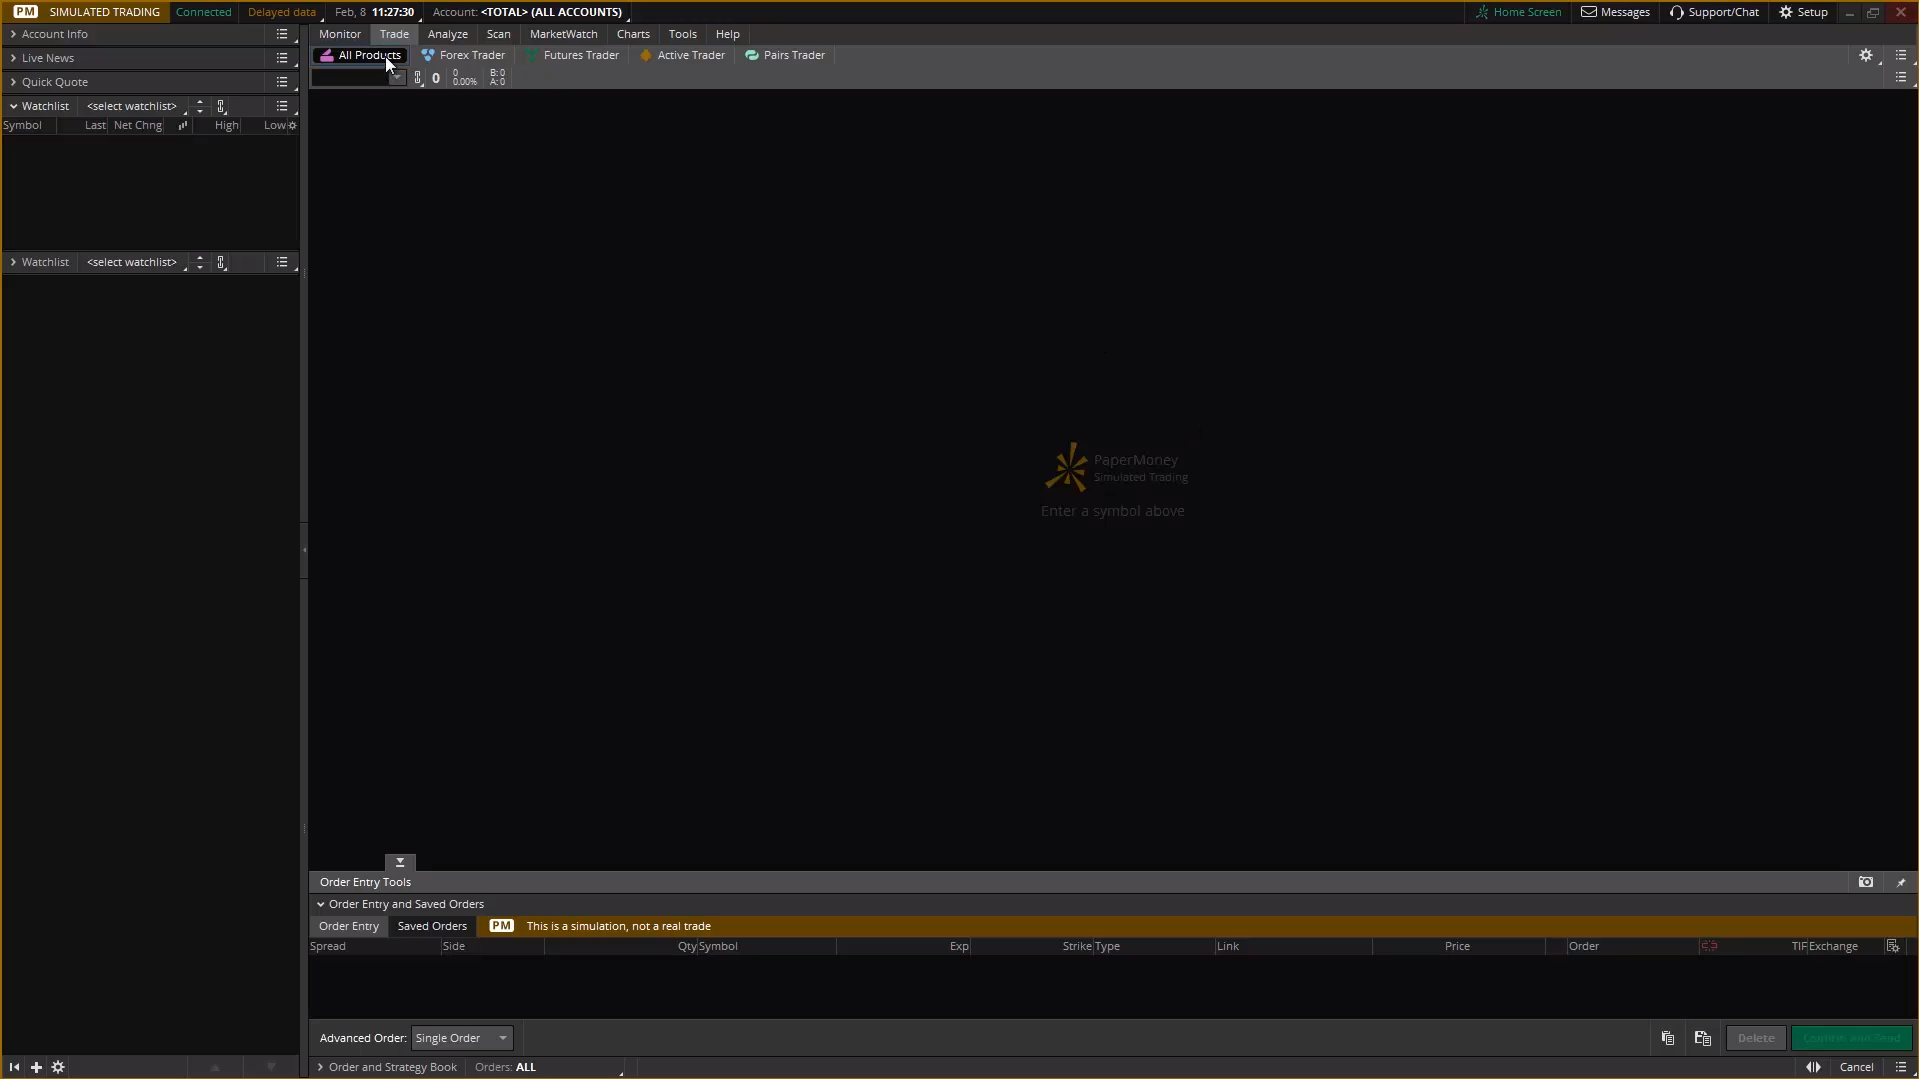
It’s on the simulation so I won’t click the wrong things and accidentally buy or sell.
You’ll search for SPY:

And over here, it was last done at a price of 270.14

To calculate how many ETFs you need to buy, you’ll use the position sizing calculator.
Let’s say it’s currently trading right now at 270.14
Since this trading system is a rebalancing approach, there’s no stop loss, so you will just keep it at zero:

As for your risk, you’ll put 100%.
All your capital will be devoted to the particular ETF that you need to buy, in this case it’s the SPY.
Let’s put $10,000 for your capital.
You’ll see:

It tells you that you’ll need to buy 37 ETFs on the SPY.
So that’s what you’ll do!
Going back to the Thinkorswim platform, you want to click buy:

You can choose the price that you wanna buy, but I’ll just go with the market order to ensure that you get filled.
And it’s last done is $270.14
You can choose the number of units you wanna buy, which would be 37 in this case:

Click confirm and you’ll see the total cost of the trade plus commission:

In this case, with a commission of about $6.95, it costs close to $10,000.
If your account is exactly $10,000 you might not be able to buy 37 units.
So, buying 36 units, is fine as well.
The cost of trade including commissions should be close to the amount of trading capital that you’re risking on this trading system.
Once you click send, an order will be sent to buy 37 units of SPY at the price of 270.14
So that’s how you’ll do it.
Recap
Let’s have a quick recap:
1. Choose a date that you want to rebalance
Be it the 1st, 2nd, or 3rd, just be consistent with the date.
If it falls on the weekend, just do it on the next working day.
2. Follow the rules
Check out the flow chart in the Resources Section.
3. Position size
Position size accordingly to the amount of trading capital that you want to devote to this strategy.
I have a position size spreadsheet that you can use as well.
4. Execution
Execute the trades on whichever trading platform that you’re using!
When you execute the trades, I recommend just going with a market order.
If you use a limit order, you might get a better price.
But if the market moves a lot and you’re not in the trade, you risk missing a huge potential move.
One final thing
I’ll briefly share how you can calculate your profit and loss.
It’s actually quite simple.
Let’s say you have $10,000
You can imagine that each month, you’ll kind of roll it over to the next month when you do a rebalance.
Sometimes you may not need to rebalance…
Because if the SPY had the greatest return over the last 1 year, you’ll be holding that position for quite a while.
So, whenever you need to rebalance you just do it accordingly.
And how you actually calculate your returns is quite simple:
If by the end of the year, your $10,000 capital has moved up to $12,000, the return is 20%.
This trading system is really simple.
There is no stop loss, it’s just a rebalancing of your portfolio.
You’ll only buy one particular ETF at any one point in time.
And that’s pretty much it!
With that said, I wish you good luck and good trading.
I’ll see you in the next lesson.
Do I sell all of my ETF and buy the new one each month if they meet the criteria? Or do I hold on to my current ETFs and add more capital to buy new ones each month?
You sell everything and buy the new ETF that meets your criteria.
Can I use other ETFs instead of the S&P 500 and ACWI when following the MMT system?
You can choose other ETFs if their expense ratio is lower. But the ETF must be representing the S&P 500 and the ACWI.
When do I sell for the MMT method?
You rebalance it every month if the rules say so.
Or else, you hold on to the existing ETF.
Do you execute buy and sell using market order?
Yes.
When you enter a trade, do you enter 100% of your trading capital?
Yes, 100% of your capital allocated for this trading system.
Should I wait for a market crash or correction and then enter trades on the MMT?
Don’t try to time the market — just follow the rules.
Let’s say I purchase SPY on 2nd Jan. On 2nd March during re-balancing, a SPY 1-year return is less than BIL. Do I sell SPY and purchase Aggregate Bonds on that day?
Yes.
The Monthly Momentum Trading System is developed using the ideas and concepts from:
Dual Momentum by Gary Antonacci
If you want to learn more, then check the book out.