
NAVIGATION
How to Implement Power Stock Trading (2/2)
Download: Video | Transcript
In this video…
I’ll walk you through on how to position size your trades and how many shares to buy.
So that you can follow the risk management that I’ve set earlier.
How to Position Size Your Trades
Recall:
You’re buying 20 equal positions of stock.
Let's say you’re going to buy FIVN:

And let's say you want to buy shares such that it’s 5% of your $100,000 portfolio value.
How do you do that?
You can do it in an Excel Spreadsheet I’ve prepared for you:
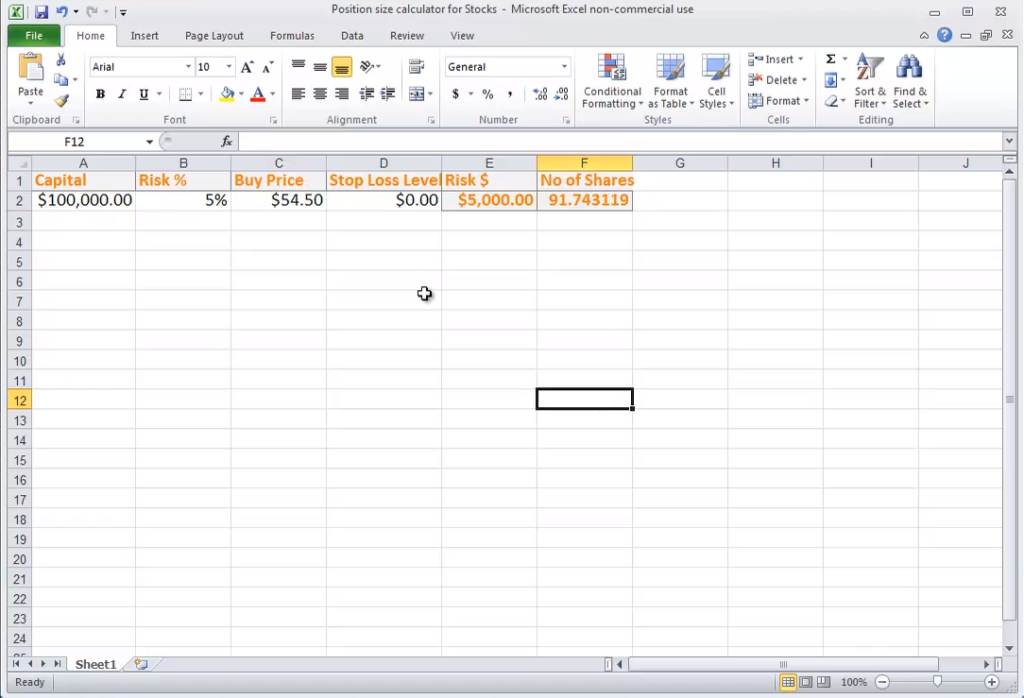
You can get it in the Resources Section.
Let's say your capital is $100,000.
Your risk is 5%.
The next thing you need to know is the Buy Price.
You can get your Buy Price by looking at the Asking Price, which is $54.50

For the stop loss level, leave this as zero.
Because you’ll manually exit the trade when it closes below 10% from the highs.
What you want to do is to buy $5,000.00 worth of FIVN at this point in time.
According to the numbers you’ve put in the Excel spreadsheet, you can buy 91.7 shares of FIVN.
If you multiply 91.7 by $54.5, you get $4959.60.
This is the total value of this stock that you're buying.
Since you cannot buy fractional shares here, let's just buy 91 shares of FIVN.
How to Execute Trades on the Thinkorswim Platform
Now, go back to the Thinkorswim platform and change the quantity to 91 with an entry price of $54.50 on FIVN:
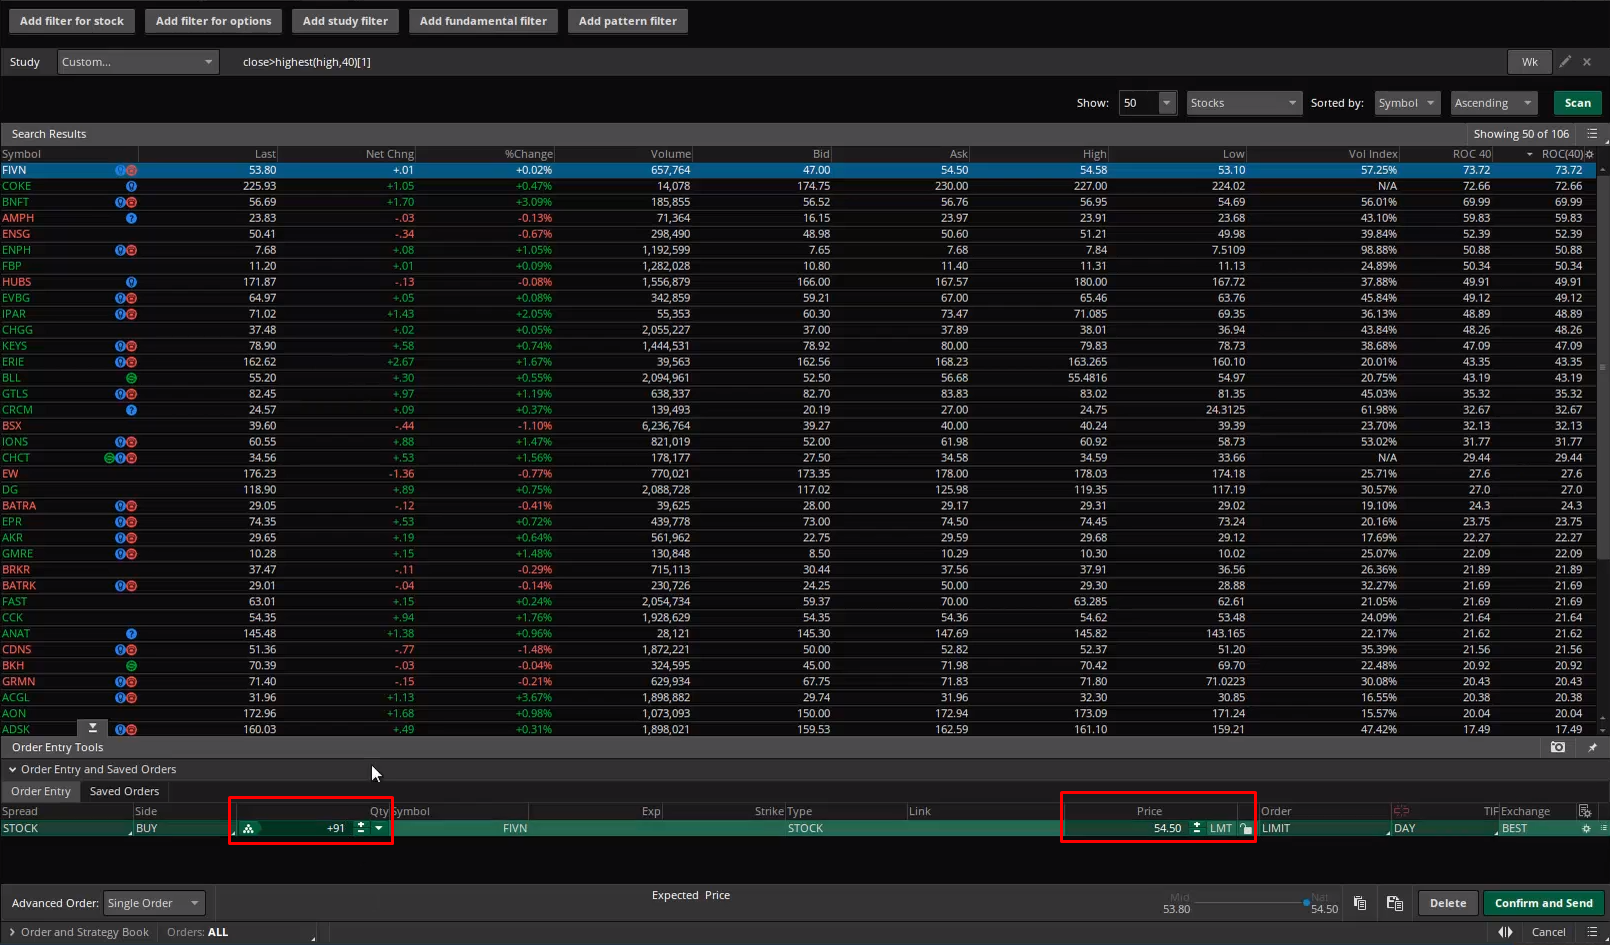
Click confirm and send:
The platform will pop out another box to confirm whether you want to buy.
This is how you do it for the Power Stock Trading System.
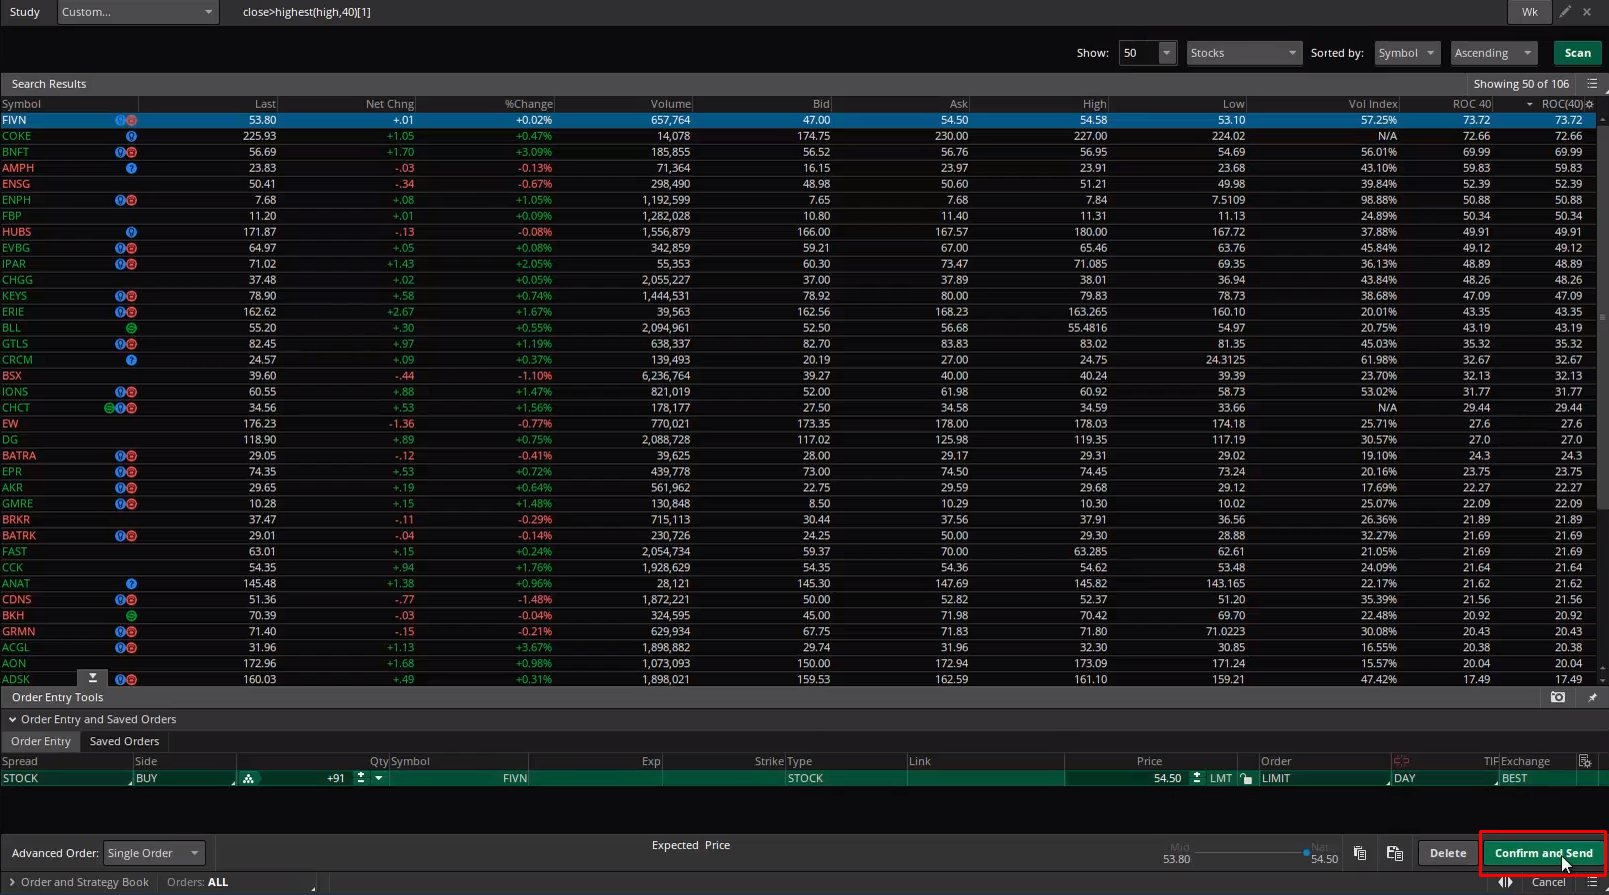
Here’s another example:
Let's say you also need to buy COKE.
COKE’s asking price is currently $230.
So, place the value into the spreadsheet over here:
And it’ll show that you can only buy 21 shares of COKE.
Now…
Go back to the Thinkorswim platform and select the COKE symbol and hit Buy:
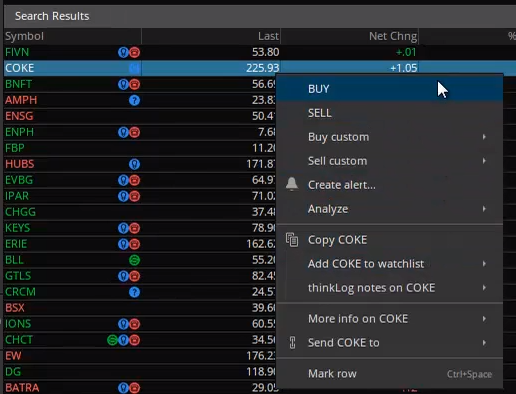
Change the quantity and price:
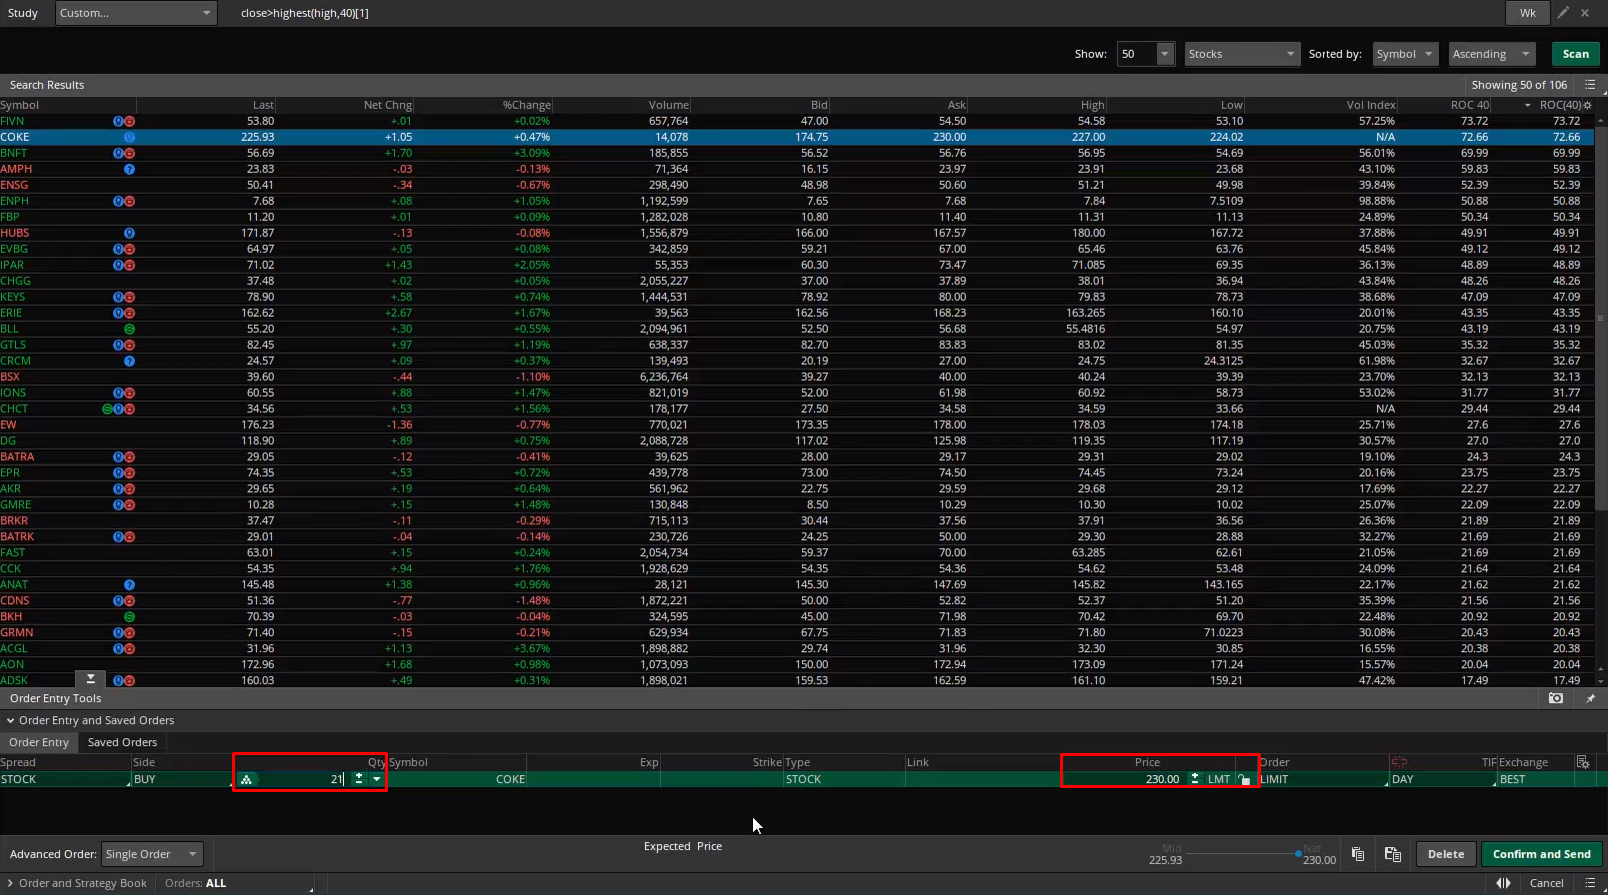
You’ll press “confirm and send”

Next…
How To Manage Your Existing Positions
Here’s the idea:
- Identify the highest price of each stock after your entry
- Insert the highest price into Excel spreadsheet to get trailing stop loss value
- Check over the weekends if the price has closed below trailing stop loss
- If price closed below – exit the stock on Monday
- If price didn’t close below – hold onto the stock
- But if Russell 3000 is below 40-week Moving Average – you’ll exit everything
I've got the spreadsheet for you in the Resources Section.
Don’t worry.
I’ll walk you through…
You have 20 stocks, stocks ‘A’ to ‘I’ and so on:
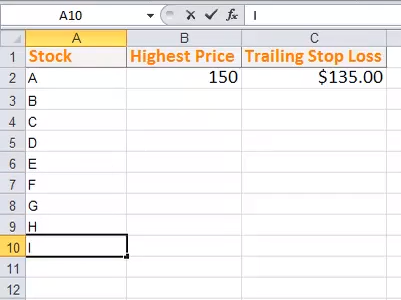
You want to identify what is the highest price of the stock after your entry.
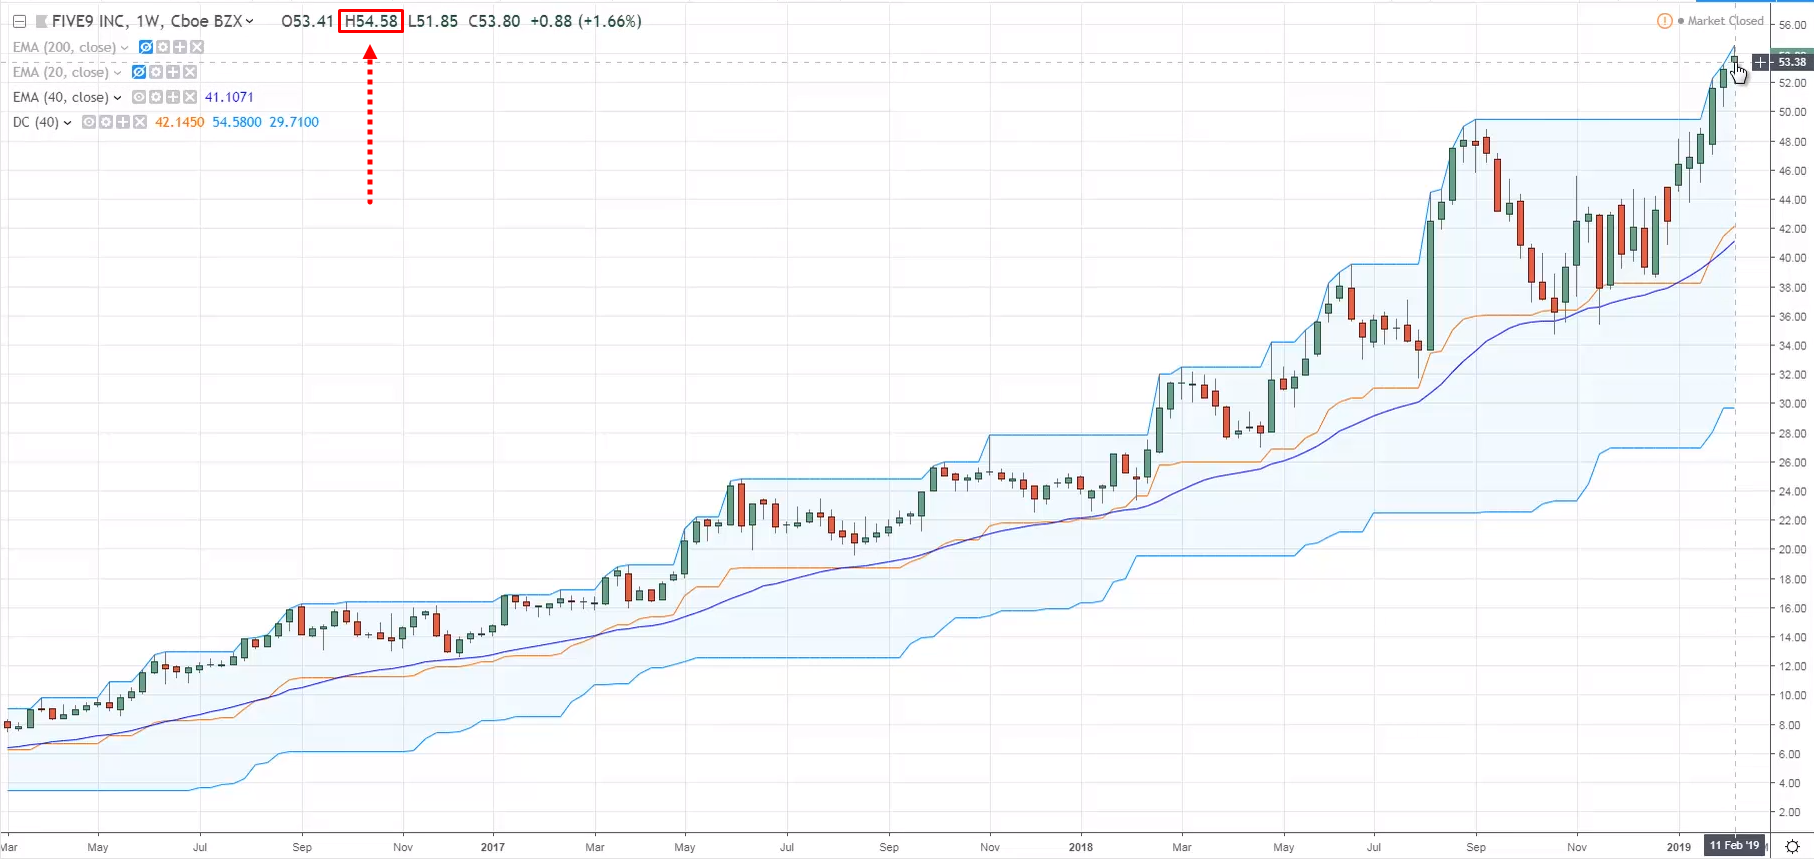
Let's say you bought FIVN back on January which breaks and closed above the 40-week high:
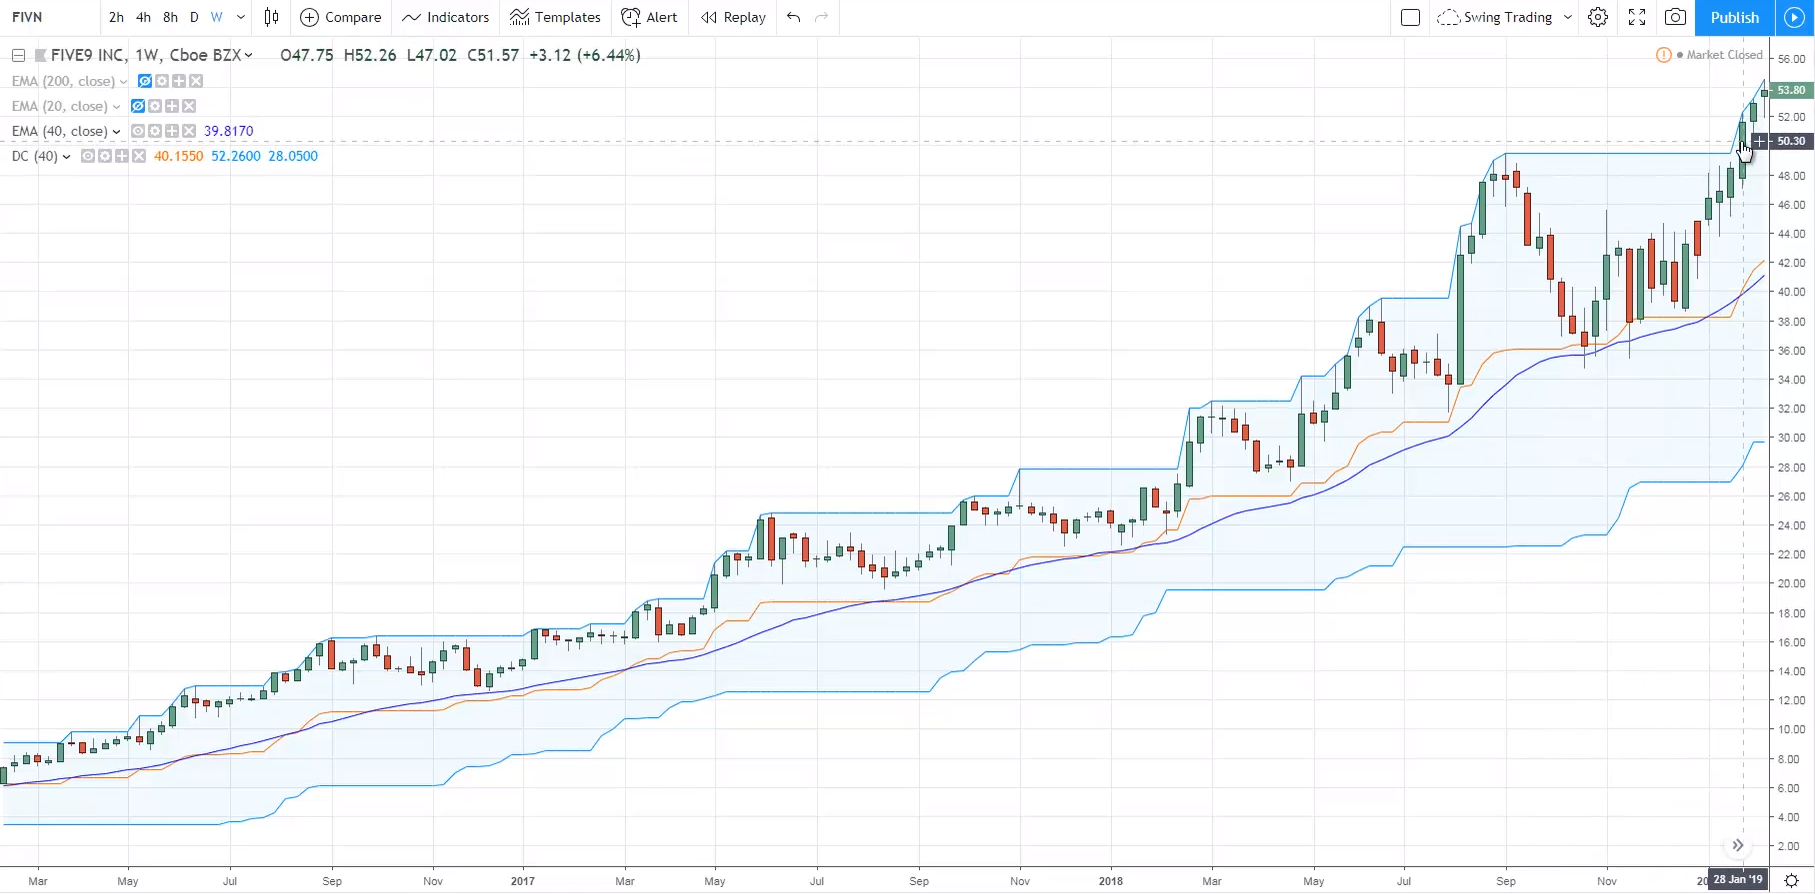
After you've bought the stock, you’ll need to identify the highest price it has been.
You can use Thinkorswim or you can use TradingView as your charting platform – it’s up to you.
On TradingView, the highest price is $54.58:
What you'll do now is you go to your spreadsheet and put in the highest price:

The spreadsheet calculated that your trailing stop loss is $49.12
So on the weekends, you’ll need to ask yourself:
“Did this stock close below $49.12?”
If it didn't, you hold onto the stock.
And this is also assuming that the Russell 3000 is above the 40-week Moving Average.
If this stock closes below $49.12, you’ll exit this stock on Monday.
This spreadsheet tells you what your trailing stop loss is for your existing position.
You’ve to do the same for all the other 20 stocks and find out their respective trailing stop loss.
Just a quick recap…
Recap
- Get a broker that allows you to trade Stocks
- Scan your watch list on the weekends for new trading setups and enter the trades on Monday
- Review current positions that hit your trailing stop loss and exit the trades on Monday
So this is how you’ll execute trades on a Power Stock Trading System.
With that said, I have come towards the end of this module.
I’ll see you in the next lesson.