
Hey hey, what’s up my friends!
Welcome to the Advanced Stock Trading Course
Welcome!
To develop this course…
I’ve actually done back tests of over 28 years of stock market data and more than 10,000 trades.
This is to prove to you what are the proven market principles that work.
Along the way in this course…
You will learn different trading strategies and techniques that work.
And I don’t expect you to apply everything to your stock trading.
So, take the concepts and principles that make sense to you and apply it to the markets.
You don’t have to apply every strategy that I’m about to share with you.
But take what makes sense to you and then apply it.
Once you are comfortable with it…
You can slowly add on more tools and techniques to your trading.
So that’s how I would suggest you go about starting this Advanced Stock Trading course!
Are you ready?
Then let’s begin...
In this video…
We’ll find out whether it is better to buy low and sell high or to buy high and sell higher.
How the research works
The research will go like this:
- I will backtest a trading strategy that looks to buy low and sell high
- I will backtest a second strategy but this time it buys high and sells higher
- All parameters will be the same except for the entries, which means trading costs is the same
- I will compare the results between the two trading strategies
Let’s get started…
Experiment 1: Buy low sell high
Let me share with you the rules of this strategy.
Buy rule
We’ll simply buy a stock when it hits a 40-week low.
There’s nothing magical with the 40-week low, it can be a 30-week, 20-week, 10-week – I’ve just simply chosen the 40-week as a random number.
Exit rule
We have a 10% trailing stop loss.
For example, the market comes down lower and hits the 40-week low of $100:

Since we’ll have a 10% stop loss, our stop loss will be 10% lower than $100 which is $90:

Now let’s say that market rallies higher to $150
Our trailing stop loss would then be 10% lower from $150 which is $135:

Filter
What happens is that sometimes you may get multiple stocks hitting new 40-week lows
Which means that there are too many stocks to buy.
What we’ll do is to buy the top 20 stocks with the largest price decline over the last 20 weeks.
Moving on…
Backtest settings
These are the parameters for testing:
- Transaction Costs: $10 per trade
- Test universe: Russel 3000 stocks
- Execution: Market open
- Maximum open positions: 20
- Test period: 2000 – 2017
- Position size: 5%
You may ask, “what does the position size of 5% mean?”
Let’s say you have a $100,000 capital…
What you would do is to assign each stock a maximum allocation of $5000 worth of shares.
Because $5000 multiplied by 20 (positions) equals to $100,000
This is what I mean by position sizing 5% of your capital.
Results
Here are the results:
- Number of trades: 1379
- Winning rate: 44.96%
- Profit factor: 1.6
- Annual return: 9.45%
- Maximum drawdown: 50.56%
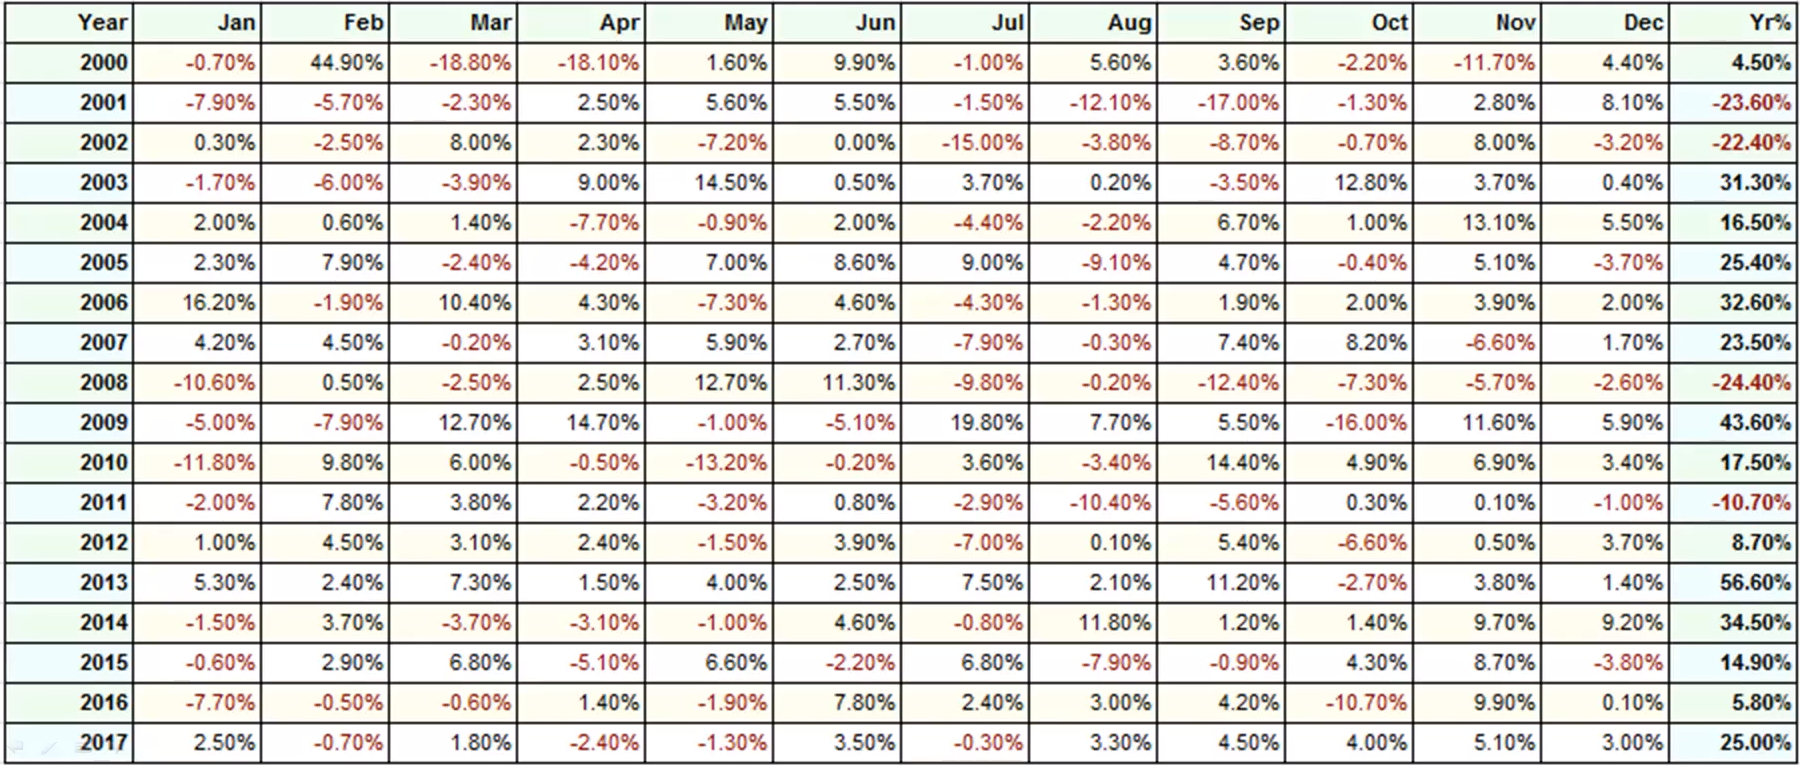
Here are the results of a month-on-month and year-on-year basis as well:
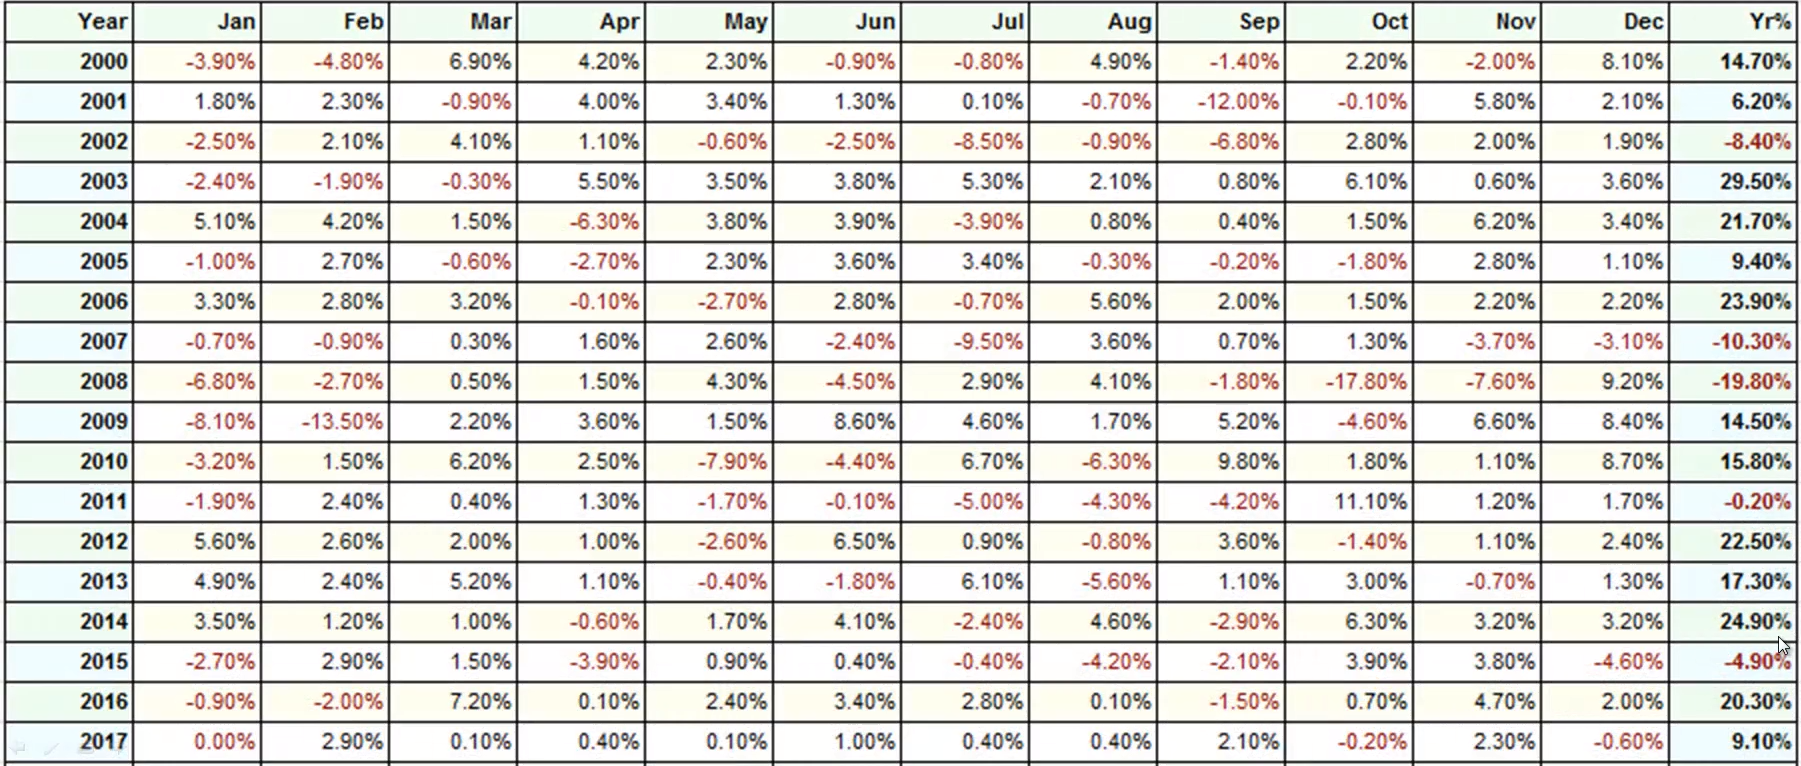
You can analyze the table if you want to.
Moving on, let’s look at the buy high sell higher approach…
Experiment 2: Buy high sell higher
Here are the rules of this second strategy.
Buy Rule
Recall, earlier we only buy a stock when it’s a 40-week low.
Now, we are only buying a stock when it hits a 40-week high.
Exit Rule
Again, 10% trailing stop loss
Filter
The filter is the same but now we are looking for the opposite.
This time, we are looking for stocks with the largest price increase over the last 20 weeks.
Backtest settings
The parameters are the same as the last strategy:
- Transaction Costs: $10 per trade
- Test universe: Russel 3000 stocks
- Execution: Market open
- Maximum open positions: 20
- Test period: 2000 – 2017
- Position size: 5%
Results
Here are the results of this second strategy:
- Number of trades: 3218
- Winning rate: 44.56%
- Profit factor: 1.41
- Annual return: 15.28%
- Maximum drawdown: 52.51%
At this point, you’re probably thinking whether this is better or worse than the earlier strategy.
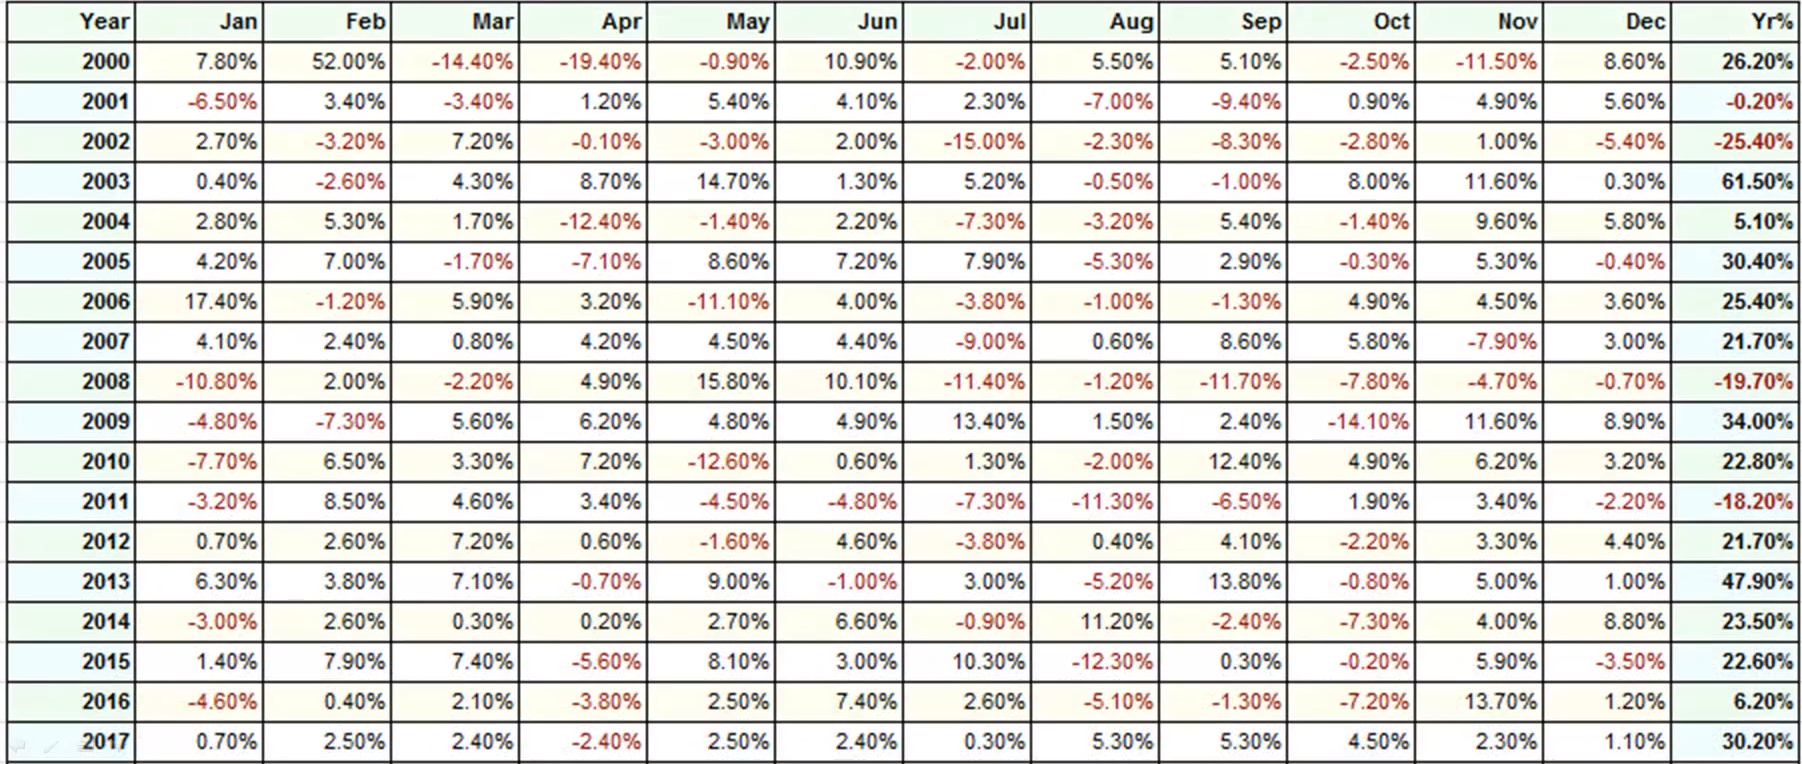
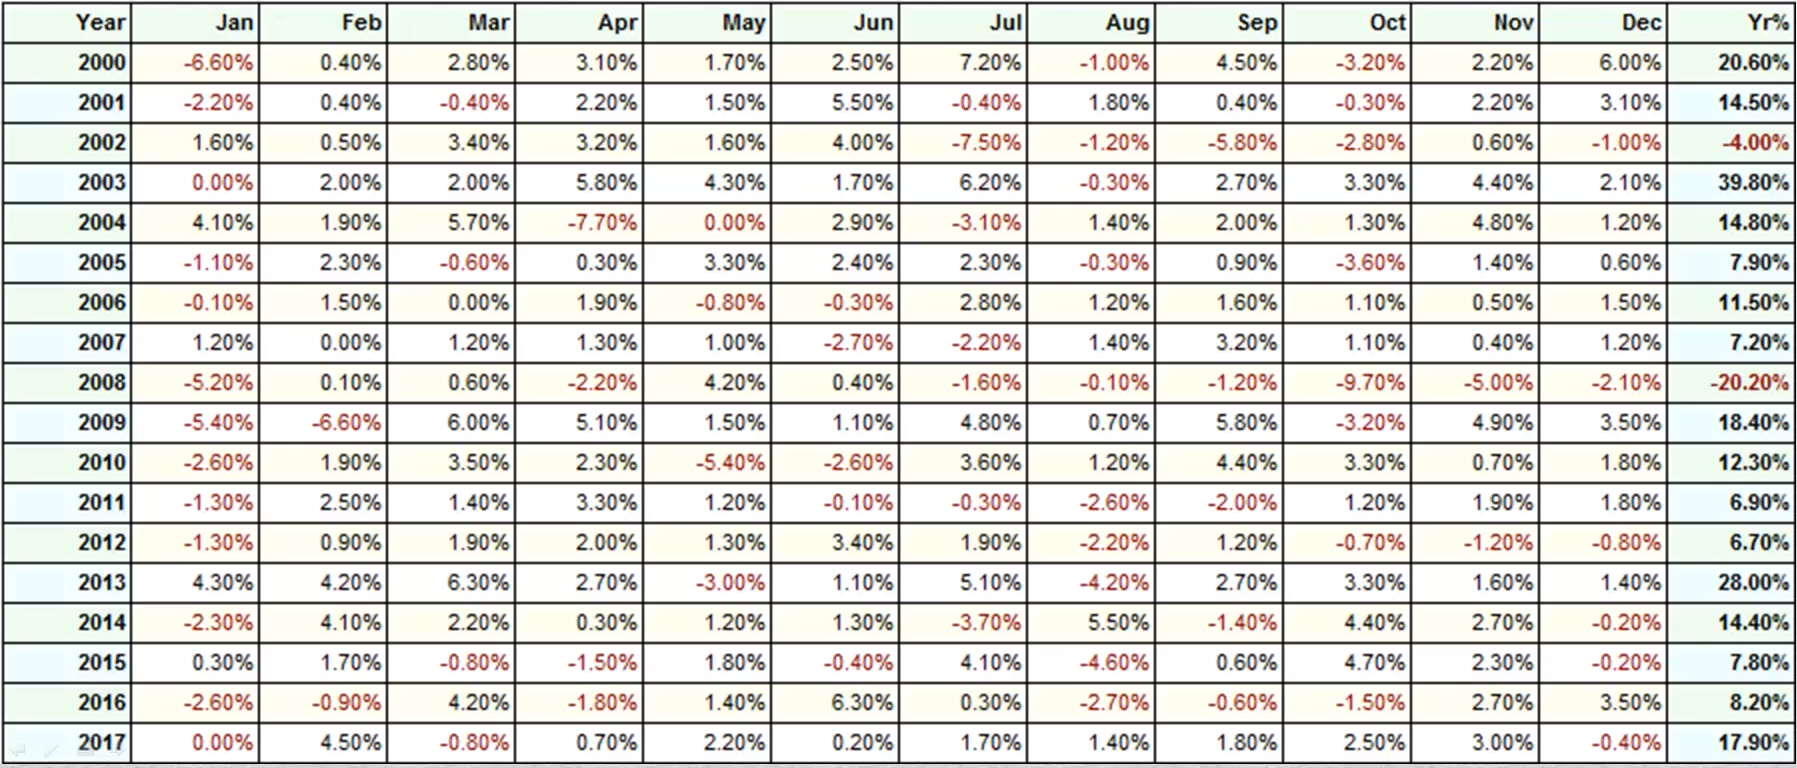
Before we move on, this is the equity change on a month-on-month and on a year-on-year basis:
Comparison of the two strategies
Now, let’s compare the two…
Buy Low and Sell High results:
Winning rate: 44.96%
Annual return: 9.45%
Maximum drawdown: 50.56%
Buy High and Sell Higher results:
Winning rate: 44.56%
Annual return: 15.28%
Maximum drawdown: 52.51%
As you can see…
The annual return of buying high and selling higher has increased by 5.83% compared to buying high and selling low.
Despite the annual returns, there is barely any difference with the maximum drawdown.
Clearly, if you ask me based on the data…
Buying high and Selling higher is a much profitable approach compared to Buying low and Selling high.
Conclusion
The quick conclusion is that…
It is more profitable to buy high and sell higher.
You can buy low and sell high, but as you’ve seen according to the data.
It is not as profitable compared to buying high and selling higher.
With that said…
I have come to the end of this post and let’s move on to the next…
Hey hey, what’s up my friends!
In this video, we’ll find out whether it’s possible to improve your stock trading returns by using this one simple filter.
How the research works
The research will go like this:
- I will backtest a trading strategy that buys on a breakout
- I will backtest the same strategy but apply a trend filter to it
- I will compare the results between the two trading strategies
Let’s get started…
Experiment 1: Breakout trading
The first strategy is just a very typical breakout strategy.
Buy rule
Go long when a stock hits a 20-week high.
This is pretty much a self-generated figure.
It can be a 10-week, 20-week, or 40-week like the earlier videos, it’s up to you.
Exit Rule
10% trailing stop loss
Filter
I would choose the top 20 stocks with the largest price increase over the last 20 weeks
Again, it can be 14 weeks, 13 weeks, 17 weeks…
It doesn’t really matter; the concept is what matters and not the parameters.
Backtest settings
This setting is pretty much the same as the earlier lessons you have learned:
- Transaction Costs: $10 per trade
- Test universe: Russel 3000 stocks
- Execution: Market open
- Maximum open positions: 20
- Test period: 2000 – 2017
Results
Here are the results:
- Number of trades: 3564
- Winning rate: 44.5%
- Profit factor: 1.37
- Annual return: 12.88%
- Maximum drawdown: 65.37%
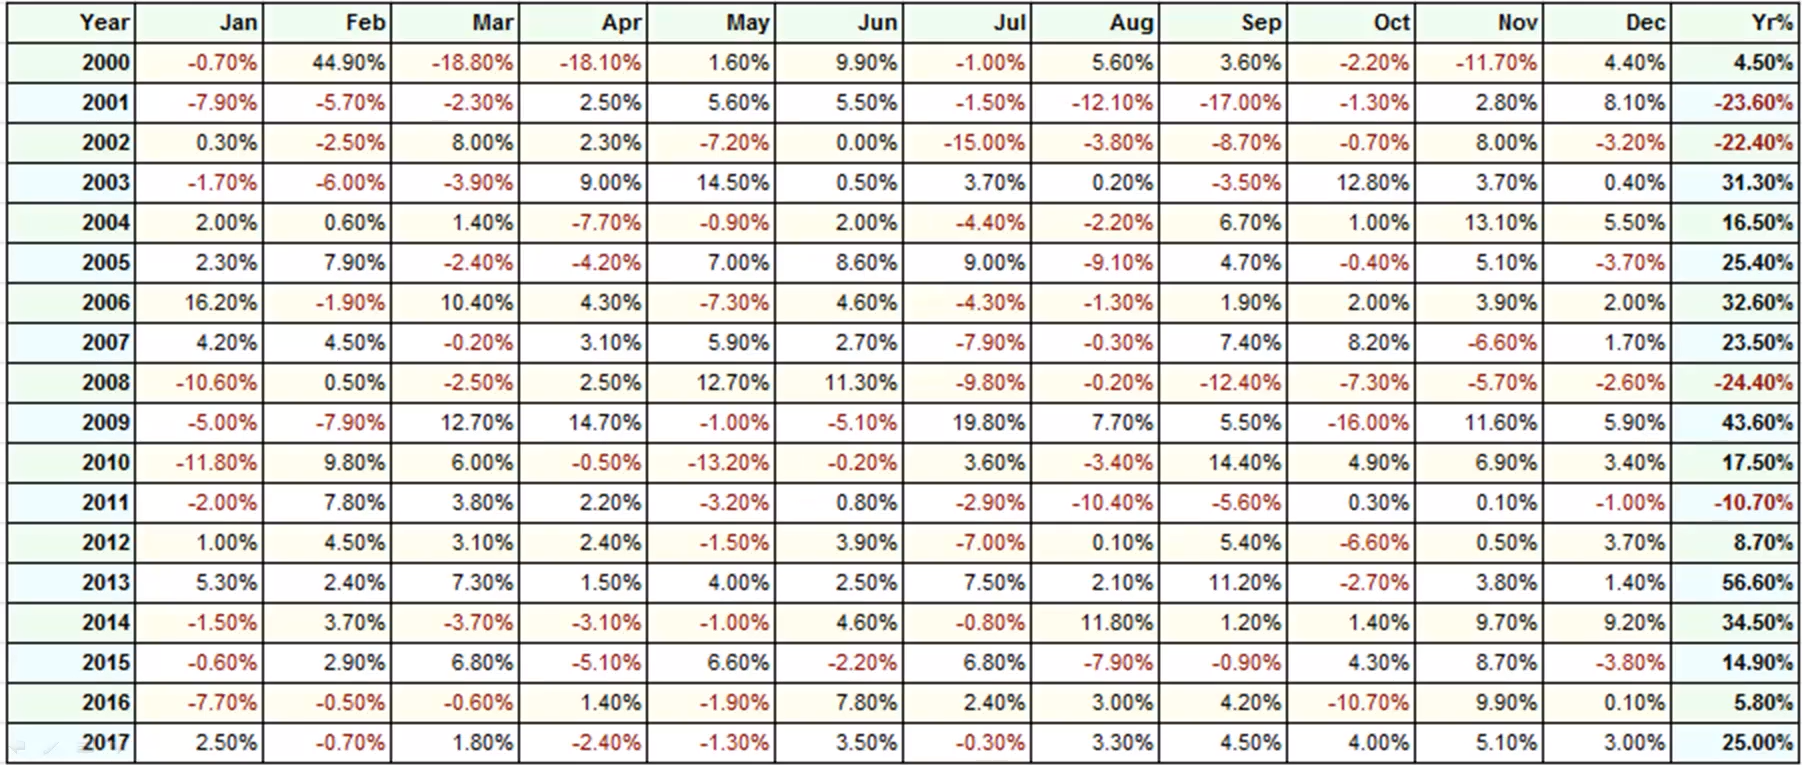
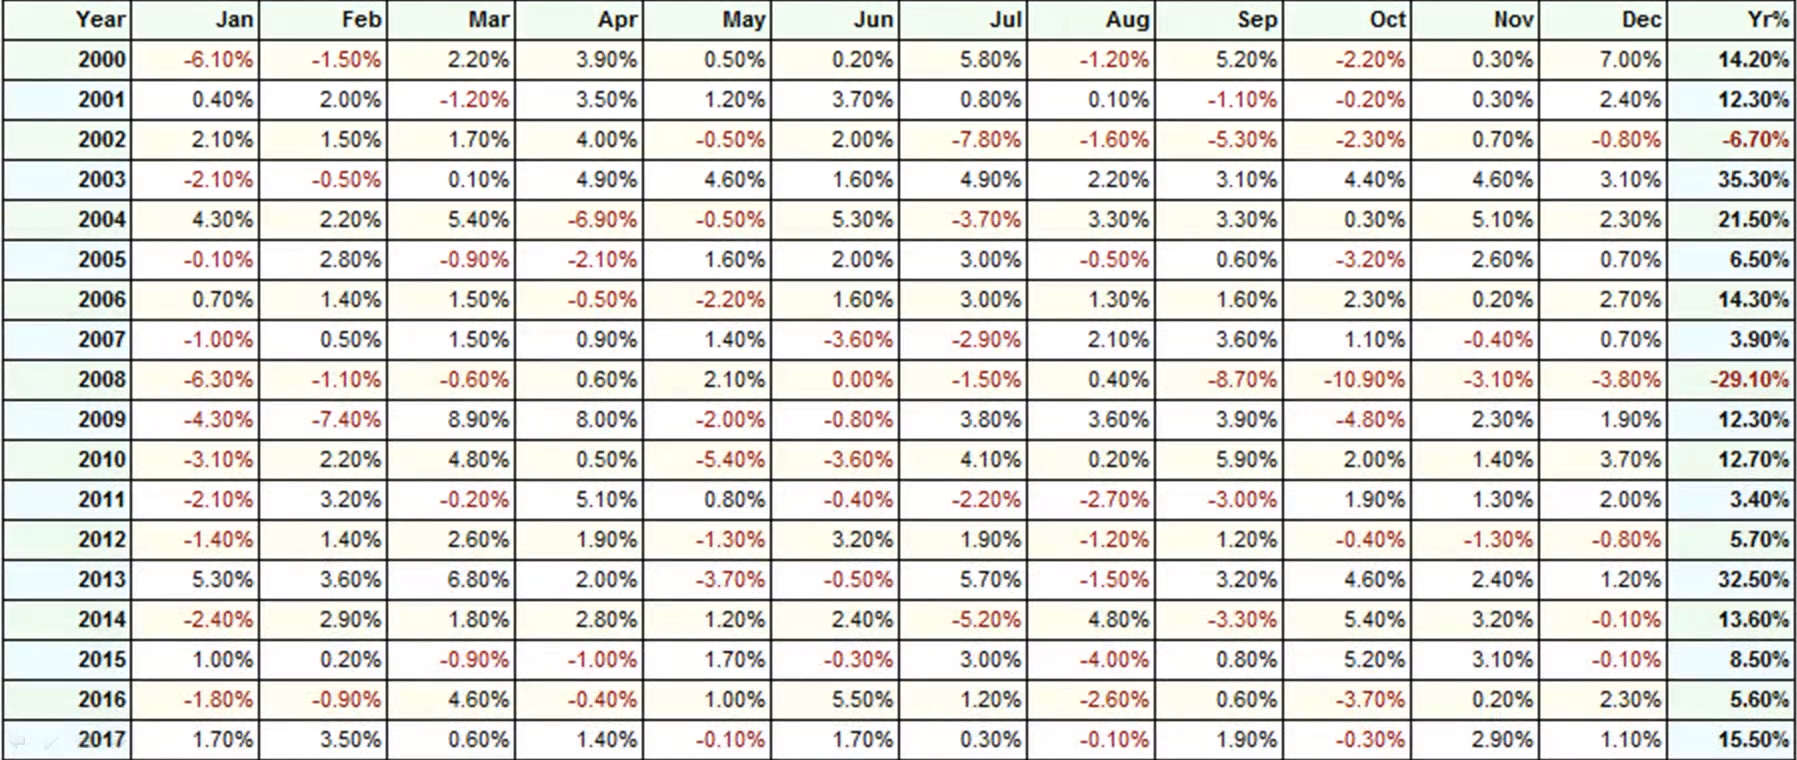
This is the returns on a month-on-month and on a year-on-year basis:
Moving on…
Experiment 2: Trend Filter
The second strategy that we will test is the one with a trend filter.
What is the trend filter?
A trend filter is a filter to identify whether you should only be long or to stay in cash.
Trend filter
S&P 500 must be above the 40-week moving average to warrant a buy setup.
And if the S&P500 is below the 40-week moving average, stay in cash.
And it doesn’t matter if the stock meets our entry conditions (20-week high).
This is a very simple trend filter to keep you in the same direction as the stock market.
If the stock market is continuously going down…
You don’t want to buy stocks because the overall market is heading lower.
That is the idea behind this strategy.
Now…
The rules are the same as the earlier strategy:
Buy rule
Go long when a stock hits a 20-week high
Exit rule
10% trailing stop loss
Filter
Top 20 stocks with the largest price increase over the last 20 weeks
Backtest settings
- Transaction Costs: $10 per trade
- Test universe: Russel 3000 stocks
- Execution: Market open
- Maximum open positions: 20
- Test period: 2000 – 2017
Results
Here are the results:
- Number of trades: 2991
- Winning rate: 44.6%
- Profit factor: 1.32
- Annual return: 10.93%
- Maximum drawdown: 43.83%
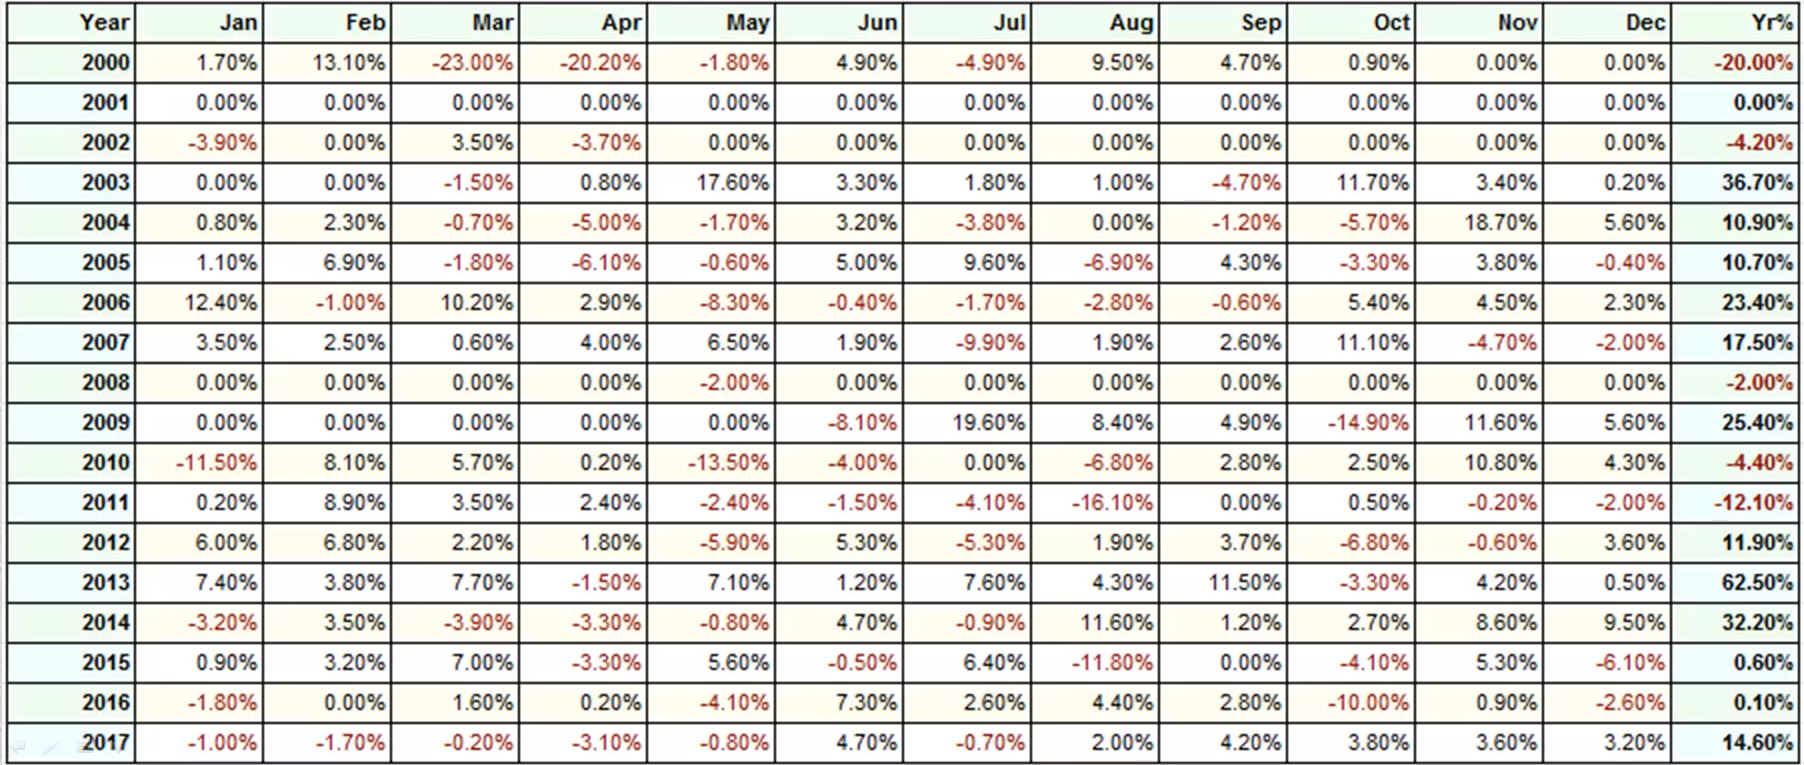
This is the returns on a month-on-month and on a year-on-year basis:
Moving on…
Comparison between the two
Let’s compare the results between the two strategies…
Breakout trading results:
Winning rate: 44.5%
Annual return: 12.88%
Maximum drawdown: 65.37%
Breakout trading with trend filter results:
Winning rate: 44.6%
Annual return: 10.93%
Maximum drawdown: 43.83%
As you can see…
The winning rate didn’t change much.
What changes the most is the maximum drawdown.
If you add a trend filter, you will notice that the maximum drawdown has decreased drastically.
As I’ve said, you will tend to be on the right side of the market more often than not.
The slight drawback in the comparison is that the annual return is decreased by 1.95%
This is a small price you have to pay for the drastically reduced drawdown.
Conclusion
A trend filter reduces your drawdown, but it also reduces your return slightly.
If you ask me, it’s quite a small price to pay so that you can sleep better at night.
Especially back in the 2008 financial crisis where you can lose a lot of money.
But if you have a simple trend filter…
You’ll whether you should be holding shares to stay in cash.
It will also contain your drawdown and reduce losses.
With that said, I have come to the end of this lesson and I will see you in the next
Hey hey, what’s up my friends!
In this video…
I want to share with you on how to find the best breakouts to trade!
Here’s how this research will work…
How the research works
The research will go like this:
- I will backtest a trading strategy that buys the breakout
- I will backtest a second strategy that buys the breakout with the buildup
- I will compare the results between the two trading strategies
If you don’t know what’s a buildup, don’t worry.
I will explain it later.
Experiment 1: Trading Breakouts with large % change
The first experiment is buying breakouts.
Here is how we would go about trading breakouts…
Buy rule
Simply go long when a stock hits a 20-week high
Exit rule
We’ll use a 10% trailing stop loss
Filter
Sometimes we’ll get many stocks that break out of the 20-week high
So, our filter is to go with the top 20 stocks with the largest price increase over the last 20 weeks!
Backtesting settings
- Transaction Costs: $10 per trade
- Test universe: Russel 3000 stocks
- Execution: Market open
- Maximum open positions: 20
- Test period: 2000 – 2017
- Position size: 5%
Results
- Number of trades: 3564
- Winning rate: 44.5%
- Profit factor: 1.37
- Annual return: 12.88%
- Maximum drawdown: 65.47%
This is the month-on-month and year-on-year results if you want to look at it further:
Now, for the next experiment…
Experiment 2: Trading breakout with the lowest volatility
So, what is a buildup?
It’s when the market’s volatility is low prior to the breakout:

This is what we are looking for, trading breakouts with buildup.
Here’s how we would go about in executing this strategy…
Buy rule
Go long when a stock hits a 20-week high
Exit rule
With a 10% trailing stop loss
Filter
We would only pick the top 20 stocks with the lowest volatility over the last 20 weeks.
This time, we are not picking stocks that have the largest price increase over the last 20 weeks.
Backtesting settings
As usual, the parameters are kept the same:
- Transaction Costs: $10 per trade
- Test universe: Russel 3000 stocks
- Execution: Market open
- Maximum open positions: 20
- Test period: 2000 – 2017
- Position size: 5%
Results
- Number of trades: 788
- Winning rate: 58.50%
- Profit factor: 2.69
- Annual return: 10.68%
- Maximum drawdown: 36.69%
The month-on-month and year-on-year results look like this:
Moving on…
Comparison of the two strategies
Let’s do a quick comparison, shall we?
Breakout with large % change results:
Winning rate: 44.5%
Annual return: 12.88%
Maximum drawdown: 65.37%
Breakout with buildup results:
Winning rate: 58.5%
Annual return: 10.68%
Maximum drawdown: 36.69%
Now…
You can see that trading breakout with buildup gives you:
- A betting winning rate
- A smaller maximum drawdown but with a slightly lower annual return
You may be wondering…
“Hey Rayner, why does the second strategy only have 788 number of trades compared to the first that has 3564?”
The reason is that trading breakouts with buildup tend to last longer.
This is why the second strategy’s profit factor is larger, and the annual return is slightly lower.
Now…
You can see that trading breakouts with buildup are more profitable with lower risk.
Compared to trading breakouts out of the 20-week high, 30-week high, or even 40-week high.
Conclusion
The conclusion is you want to be buying breakouts with buildup.
Because it’s been shown it increases your winning rate, it’s more profitable, and it decreases your drawdown.
With that said…
I have come to the end of this lesson, and I’ll see you in the next.
Now…
The question is how to actually improve your results based on what you’ve just earlier!
So, I want to share with you a few guidelines that you can use to improve your stock trading returns.
How to improve your results
Number one…
Buy high sell higher
As you’ve seen earlier.
It’s far more profitable to buy as the price is already moving in your favor.
This means that you don’t want to catch a falling knife.
Because if you try to buy low and sell high…
Chances are the odds are not in your favor.
So it’s far more profitable to buy high sell higher, otherwise known as trading breakouts.
Trend filter
This one is very straightforward.
As you know…
“A rising tide raises all boats.”
So, what you want to do is to see what the general market is doing.
If the general market is:
- In an uptrend, then it makes sense to be buying stocks
- In a downtrend or is in a recession, then you want to stay in cash
A simple trend filter that you can use is the 40-week moving average.
But you don’t have to use the 40-week moving average if you want to…
You can use the 39, 38, 37, or the 200-day moving average.
It’s not going to matter that much.
What’s important is the concept that you are using.
The third thing is…
Buy breakouts with a buildup
As you’ve seen earlier…
Buying breakouts with a buildup are much more profitable compared to just blindly buying breakouts.
Again, a build up is when the market is in a range and then goes into a tight consolidation prior to the breakout:

The tighter the consolidation (buildup) is, the more favorable the breakout trade is.
This also means that you have to…
Avoid buying breakouts where the price has already moved a lot in a short period of time already
Here’s what I mean:

You can see that the price did not make a buildup prior to its breakout.
As you’ve seen earlier, this type of breakout trades is not very profitable.
And more often than not, it tends to reverse back lower:

Because if you think about this…
If the market has already moved so much in a short amount of time, the buyers will be exhausted.
And there’s a higher likelihood that the market will reverse lower.
So, these are the four useful tips that you can use that will improve your stock trading results.
With that said, I will see you in the next lesson!
Often times traders ask me…
“Hey Rayner, do you pay attention to fundamentals in the stock markets?”
I often say that you don’t need to know the fundamentals.
Because the price is what matters.
But then again…
Some of you want to use fundamentals to add another layer into your trading, to enhance the trade working in your favor!
So, I want to share with you a few simple guidelines to follow to know which are the key fundamentals for you to focus on.
How to use fundamentals
If you ask me, the important thing that you want to do is to…
Focus on revenue
This is otherwise known as sales.
Because if you think about this…
At the top of the accounting, statement is revenue.
As the numbers go down lower due to goods sold, expenses, depreciation etc.
Those numbers are easier to manipulate.
For example, if you talk about net profit, it is pretty much what you keep after accounting the expenses!
But if you think about this…
There are many variables that can be so-called “manipulated” to show you a good net profit.
For example, your revenue can be the same but your net profit has increased.
This may be because you have reduced expenses, laid-off more workers.
And in the long run…
You can see that it’s not sustainable!
What’s sustainable in the long run is to increase revenue and sales.
If you have more revenue and more sales…
Your company is looking healthy in the long-run.
Now…
You don’t have to concern yourself with operating expenses and other minor details.
Because revenue is the most important.
This is the key thing that you want to look for.
If you’re looking to buy stocks and you are comparing their fundamentals.
What you need to do is to…
Choose stocks that have the highest revenue increase over the last 3 years
This tells you that the company is clearly earning, and is healthy and fine.
Net profit could be down.
Maybe expenses have to increase overtime or debt they have to write-off.
But that is not important.
What’s important is that you want to pick stocks that have the highest revenue increase over the last 3 years!
Also, you want to go with stocks with the…
The highest increase in revenue quarter on quarter (last year)
What this means is that if you are comparing the first quarter of this year…
You want to compare this quarter from the same quarter last year.
For example, if you’re looking at January to March as your quarter, you want to compare that quarter to the revenue results of January to March last year.
So, these are the key things that you want to pay attention to.
If you want to use fundamentals, I would recommend you to look at revenue.
Anything that goes lower in the P&L statement can be manipulated easily and they are not an accurate gauge anymore.
Fundamentals are good as an additional overlay.
For example, you have identified several stocks that have the same trading set-up:

Which stocks do you go for?
What you can do is to add a fundamental overlay to decide which stocks you want to go with.
Usually, those that have better fundamentals are the stocks that will trend longer.
With that said, I have come to the end of this lesson and I will see you in the next.
How to identify value stocks that outperform the market
Hey hey, what’s up my friends!
In this video, I will share with you on how you can go about finding value stocks in your trading.
This actually came about when I was in university.
I was studying a finance module and I came across this section how value stocks beat glamour stocks!
It’s a research done by Lakonishok, Shleifer, and Vishny.
What are value stocks
Value stocks are stocks that underperformed over the last few years.
This is usually because of poor earnings and their stock prices are the worst in the last few years.
Usually, these stocks tend to outperform the market in the next few years!
This was the first insight that I had.
The 4 stages of the market
When I was a trader…
I studied the 4 stages of the market that I learned from Richard Wyckoff, and Stan Weinstein.
Basically, the 4 stages of the market are:
- Declining stage
- Accumulation stage
- Advancing stage
- Distribution stage
Here’s what it looks like:

When I studied these 4 stages in the markets especially the accumulation stage…
It rang a bell in my head.
Because it is so similar to the concept of how value stocks beat glamour stocks!
With this idea in mind…
I wanted to test this and see whether this concept gives you an edge in the markets
Experiment strategy rules
How I go about testing this idea would be like this…
Buy rule
Look for stocks that decline the most over the last 2 years, then go long when it this a 20-week high
Exit rule
10% trailing stop loss
Lookback period
1 month
Now…
Let me explain what is the 1-month look back period further.
For example, the stock has declined for the past 2 years.
Then it breaks out of the 20-week high.
I go long with a 10% stop loss:

When the stock hits a 20-week high on February 2019…
I would look at the price of January which is 1-month ago.
Then…
I would calculate the 2-year decline from January 2017 to January 2019
Here’s what I mean…

The reason why I have a lookback period is that if I calculate the highs 2 years ago and the time of break out…
It would not have declined the most over the last 2 years since the market has already rallied reaching the 20-week high.
That is why I need to identify where the “2 years” start and end!
With that said…
These are the backtest criteria
Backtest settings
- Transaction Costs: $10 per trade
- Test universe: Russel 3000 stocks
- Execution: Market open
- Maximum open positions: 20
- Test period: 2000 – 2017
- Position size: 5%
Here are the results…
Results
- Number of trades: 934
- Winning rate: 51.5%
- Profit factor: 2.12
- Annual return: 9.31%
- Maximum drawdown: 39.39%
The month-on-month and year-on-year results look something like this:
This test has actually shown you that this strategy beats the market.
However, I wouldn’t suggest that you trade this strategy.
Because the drawdown can be very steep.
But we are onto something as it shows you that if you buy breakouts after a decline…
It actually beats the market.
Now…
The key thing that I want to point out to you is that this is a concept that you can use in your trading!
Conclusion
The conclusion is that you can consider buying breakouts after a long-term decline.
And based on the research of Lakonishok, Shleifer, and Vishny…
Stocks that performed poorly over the last 2 years tend to outperform the markets.
Additionally…
If you use something like an index filter like going long only if the index is above the 200-day moving average, the results will even be better.
With that said, I hope this helps you in your trading.
And I’ll talk to you soon.
In this video…
I want to share with you something really powerful.
It’s how to find the strongest and the best stocks in the market.
You might be wondering…
“Hey Rayner, why do I want to find the strongest stocks, why not just any ordinary stocks?”
Let me explain why…
How finding a strong stock works in good and bad times
For example, the S&P 500 drops 10%
If you are holding a strong stock, you would not have to suffer the same drop as the S&P 500.
In fact, you could possibly just endure a 5% decline only.
Half the pain of the index’s poor performance.
Now…
Let’s say the S&P 500 has recovered and made a rally of 10%.
If you’re holding a strong stock, you can expect a recovery of more than 10%.
Maybe 15% to 20% or even more.
You can expect to endure less pain and enjoy a greater return if you’re holding a strong stock compared to the S&P 500.
How to find the strongest stocks
Let me share with you a few guidelines on how you can identify the strongest stock out there…
1. Look for a correction in the stock markets
If you are trading US stocks.
What you want to do is to wait for a correction in the stock markets.
Because this is where you can really identify which are the strongest stocks out there.
2. Identify stocks which are holding well (% change, moving average)
When the stock index corrects…
The strongest stocks are usually the ones that hold up well.
For example, the stock market drops by 10%.
And you notice stock ABC only dropped 5%.
You know that this is a stock that’s holding up pretty well relative to the S&P 500.
What happens is that if the S&P 500 recovers, this stock ABC would lead to a stronger recovery than the S%P 500.
Later I will share with you two techniques on how you can identify which stocks are holding well.
We will use the % change and the moving average technique.
And the results would be the strongest stocks likely to breakout higher
Let me walk you through a few examples…
Moving average technique
This technique is quite straight forward.
It doesn’t really matter if you use a 40, 50, whatever.
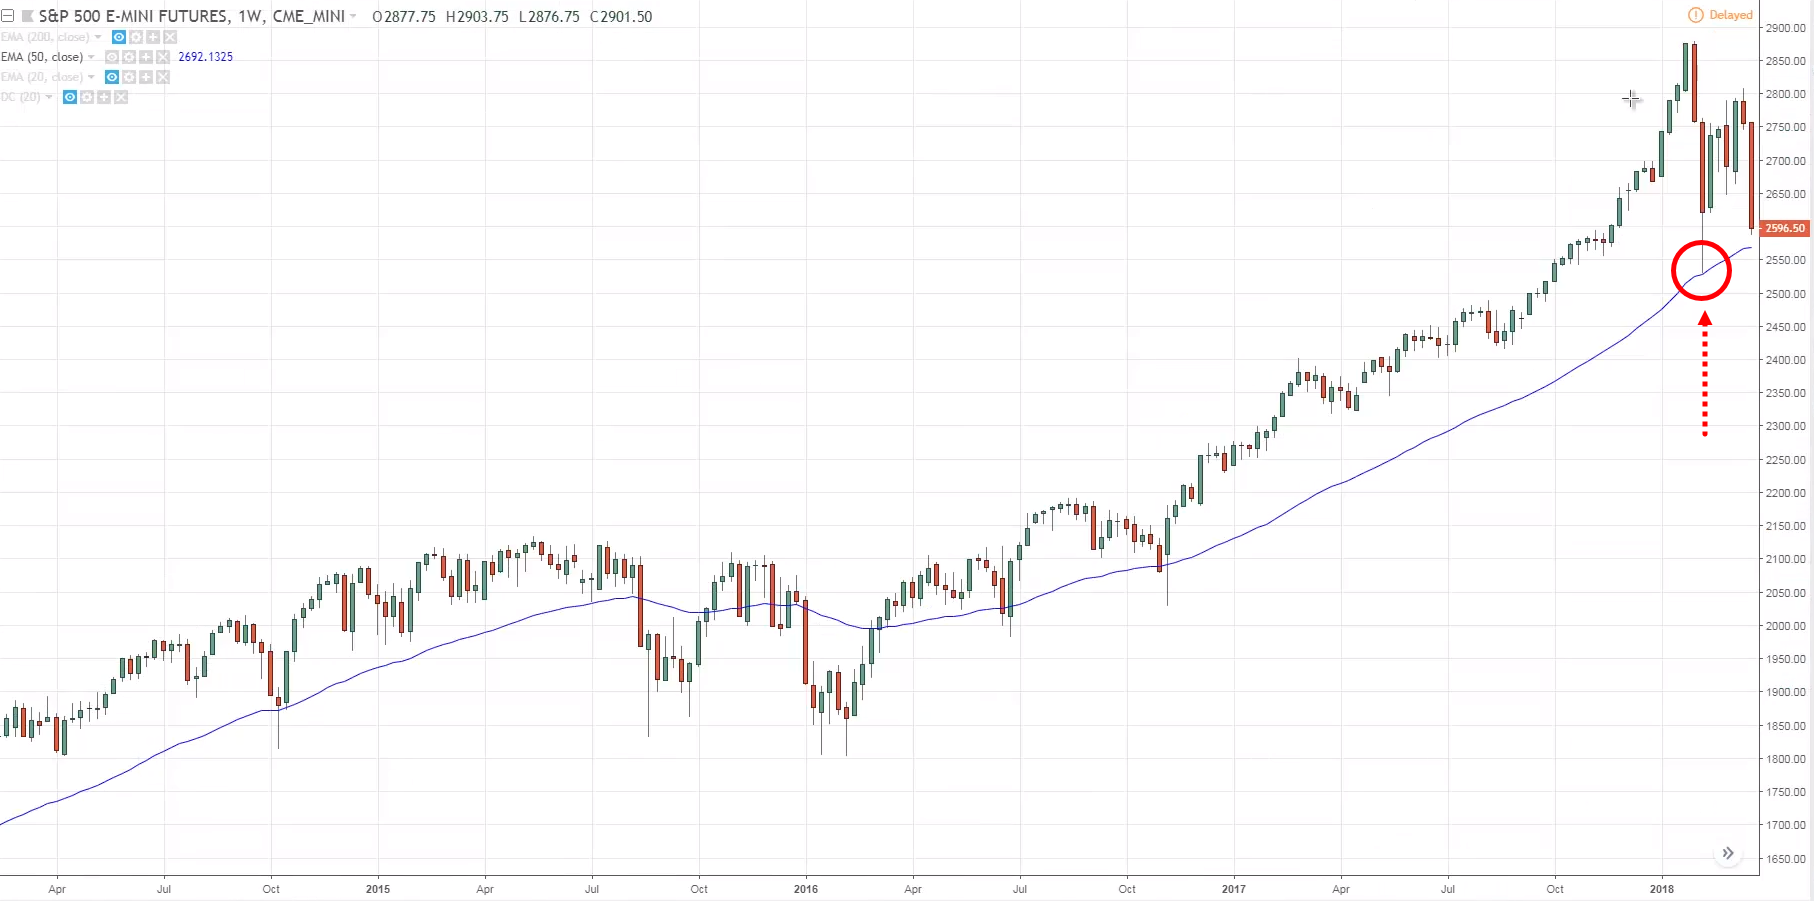
But as you can see, I am using the 50-period moving average:

You can see that the S&P 500 has retested the 50-period moving average:
If you have a strong stock…
That strong stock wouldn’t retrace as deep as the S&P towards the 50-period moving average.
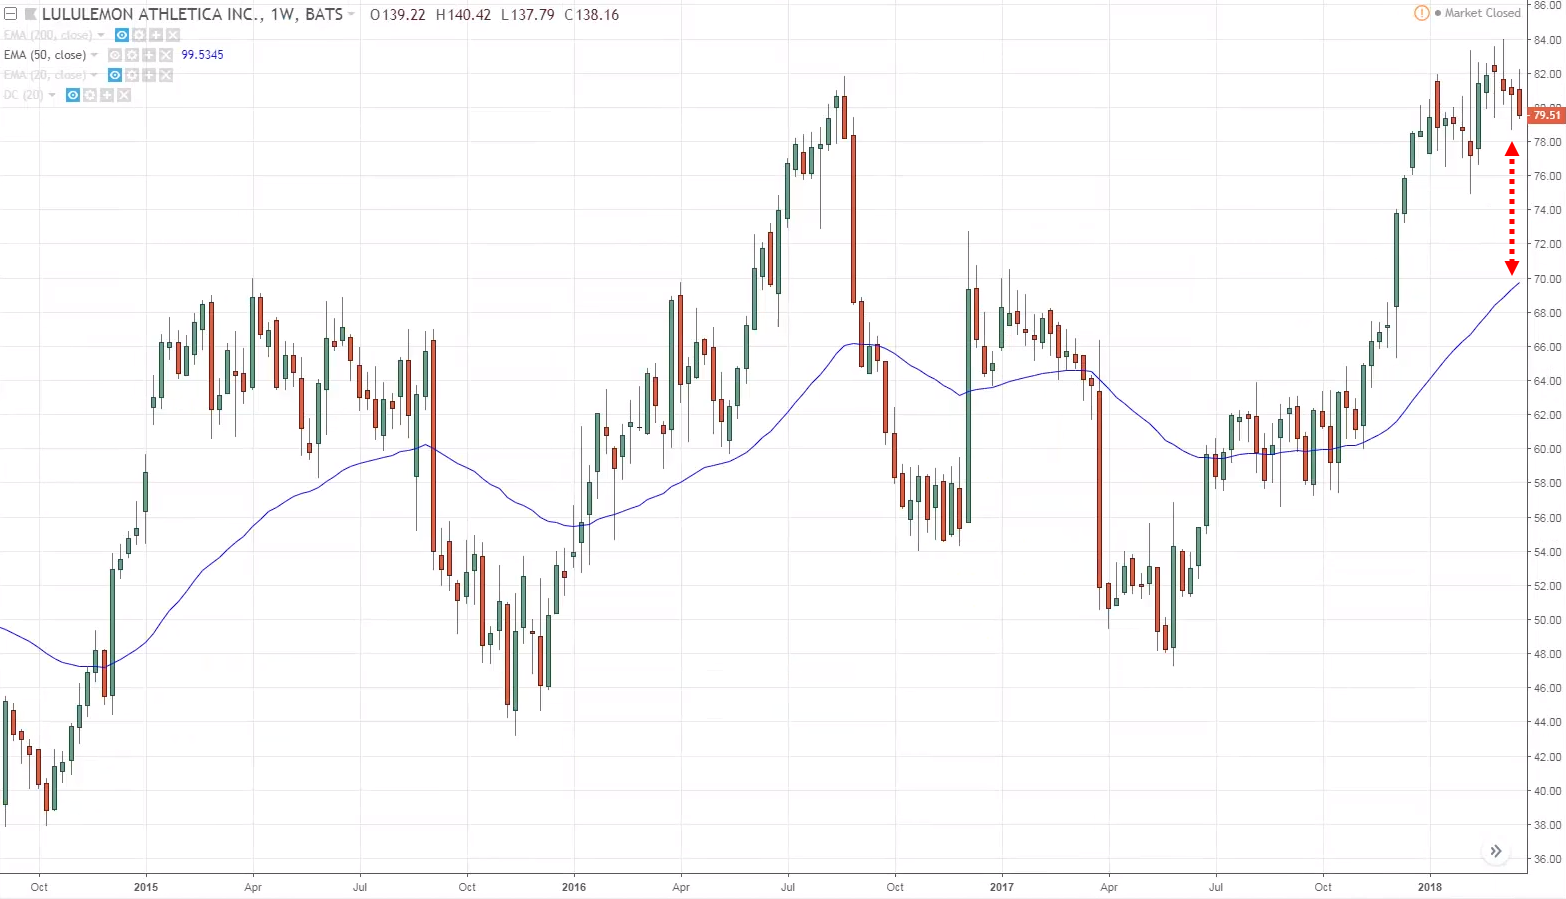
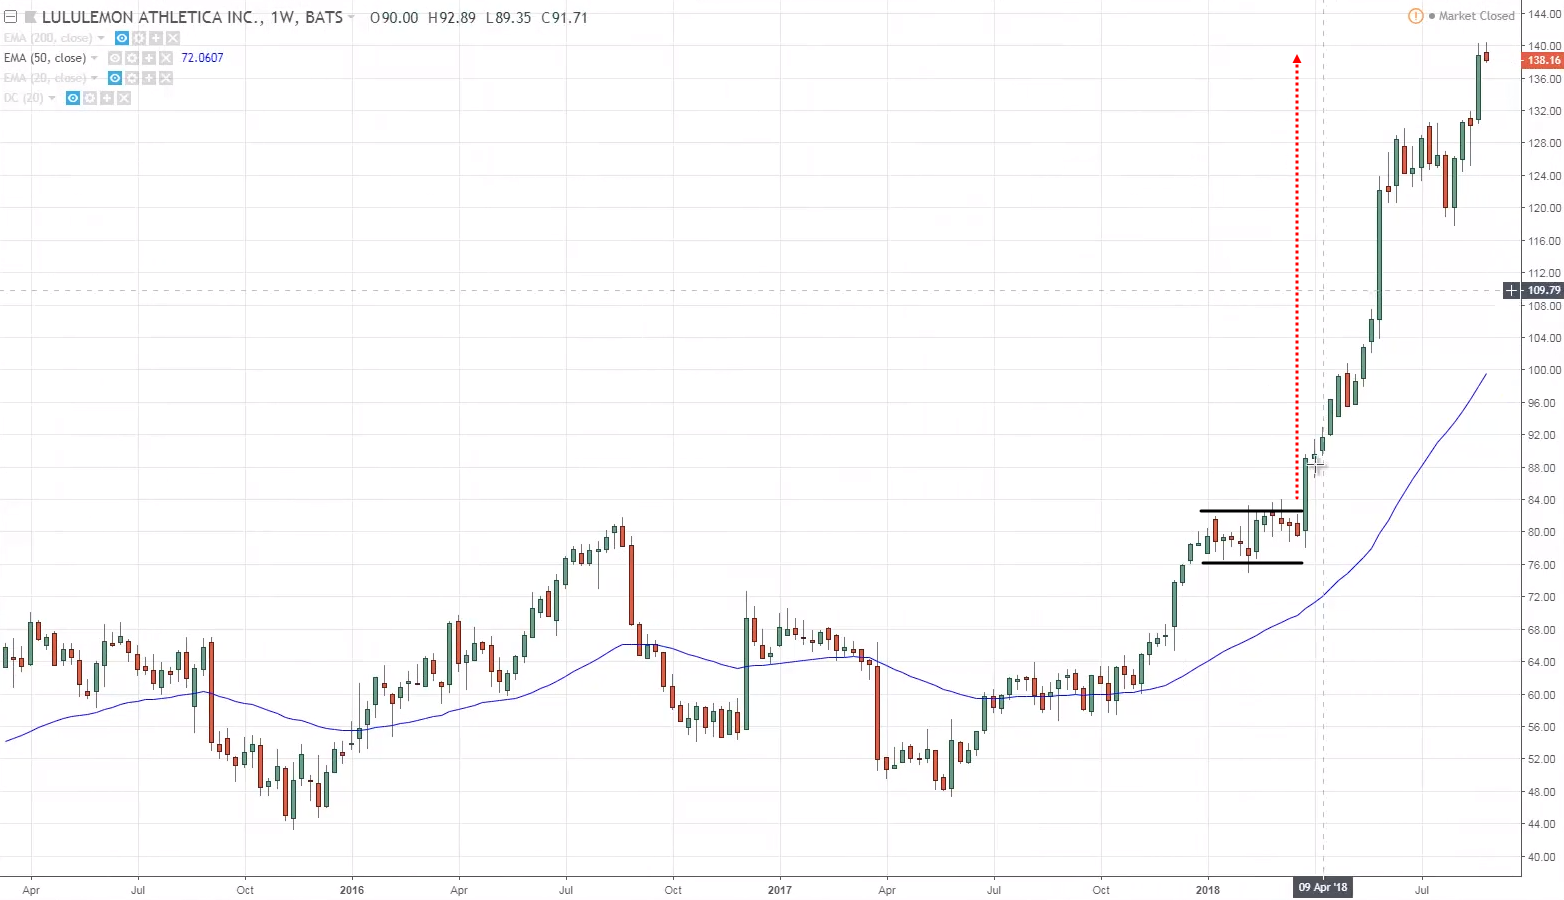
For example, LULU:

In the same time period as discussed in the S&P 500…
LULU only made a slight retracement and is still far away from the moving average:
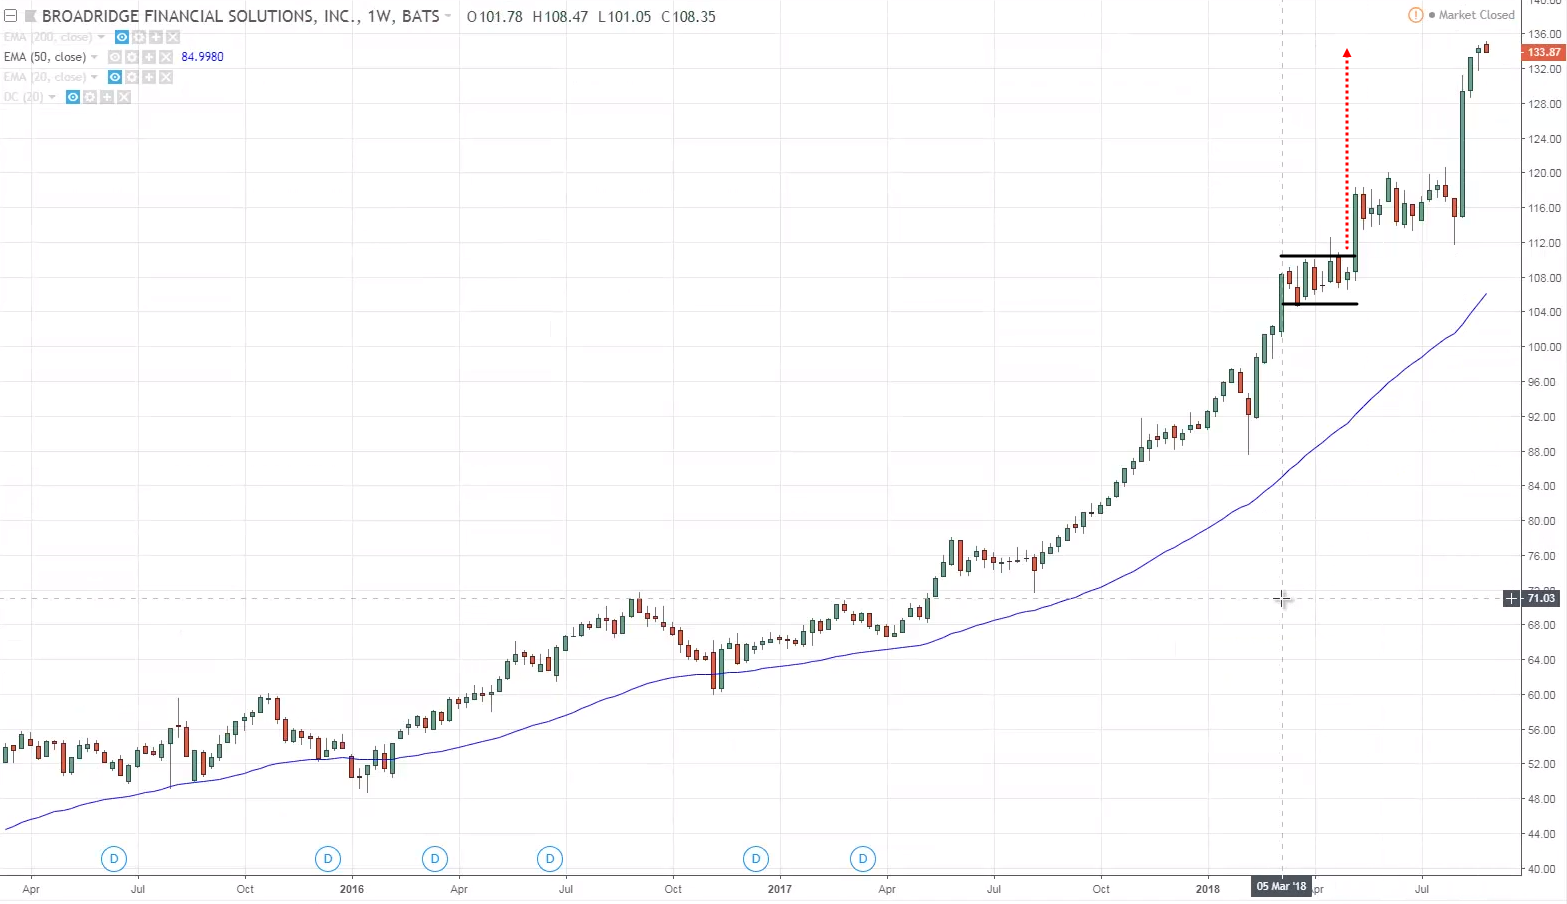
And if we look at BR:
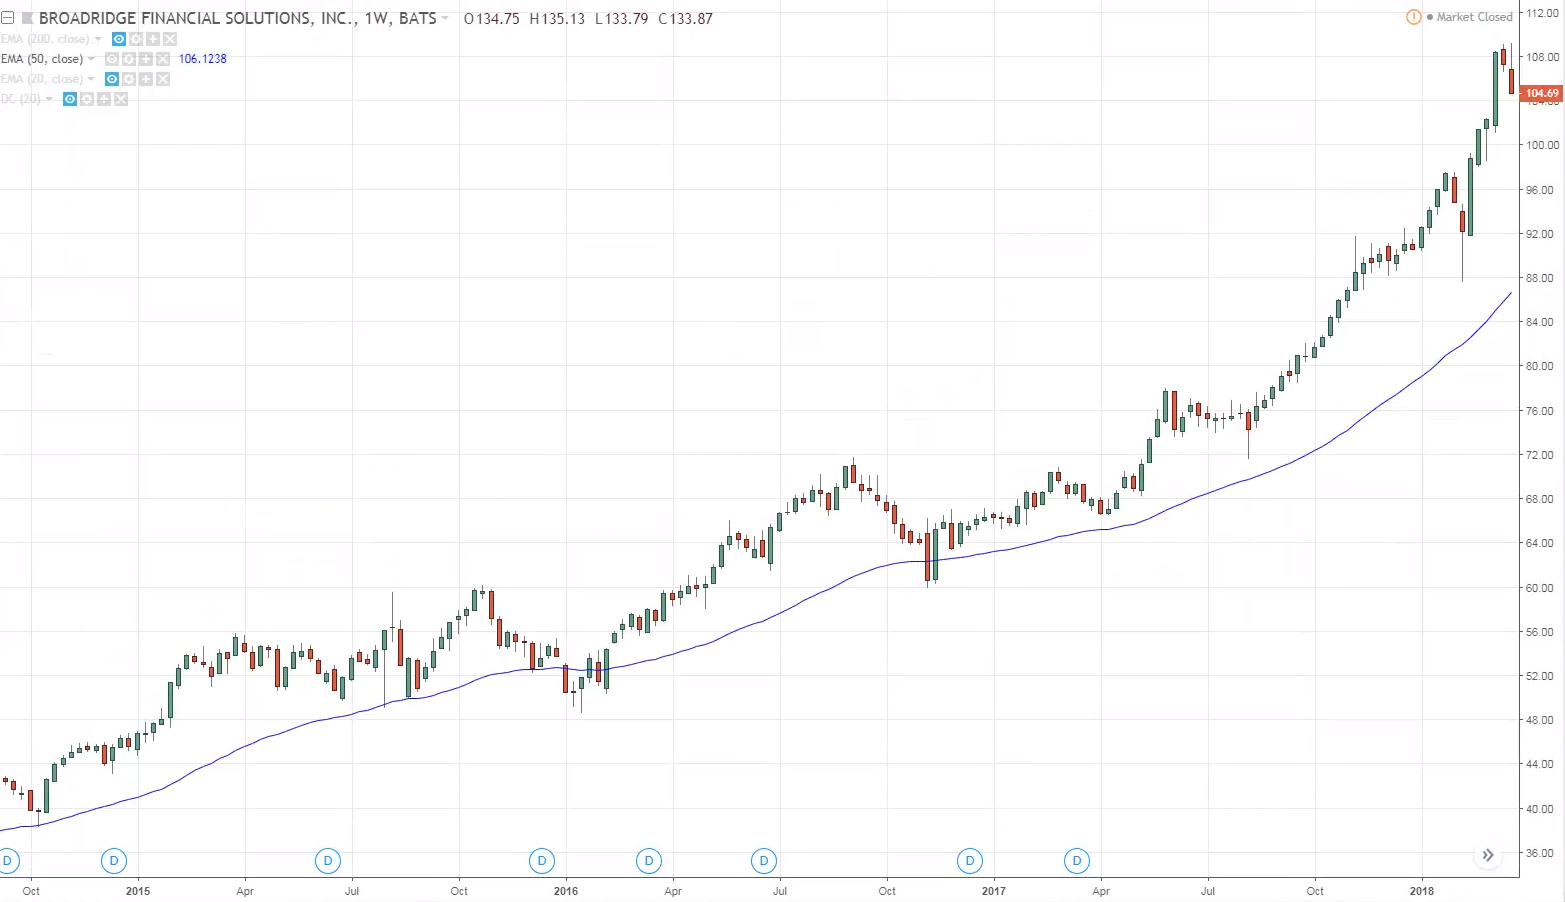
Its price is also very far away from the 50-period moving average!
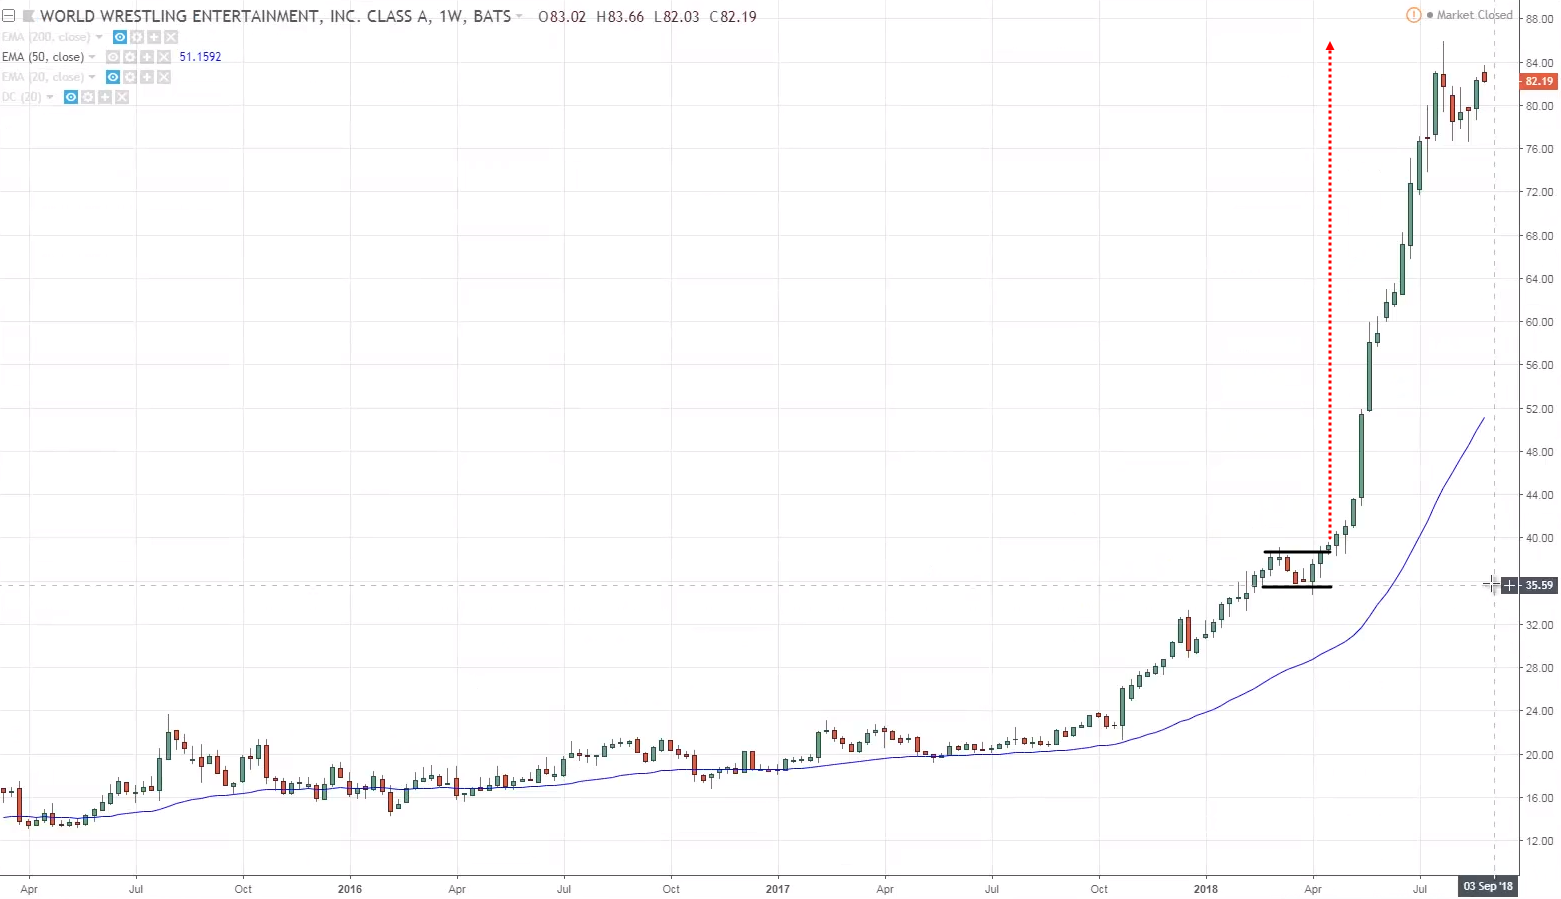
Now, if we look at WWE:
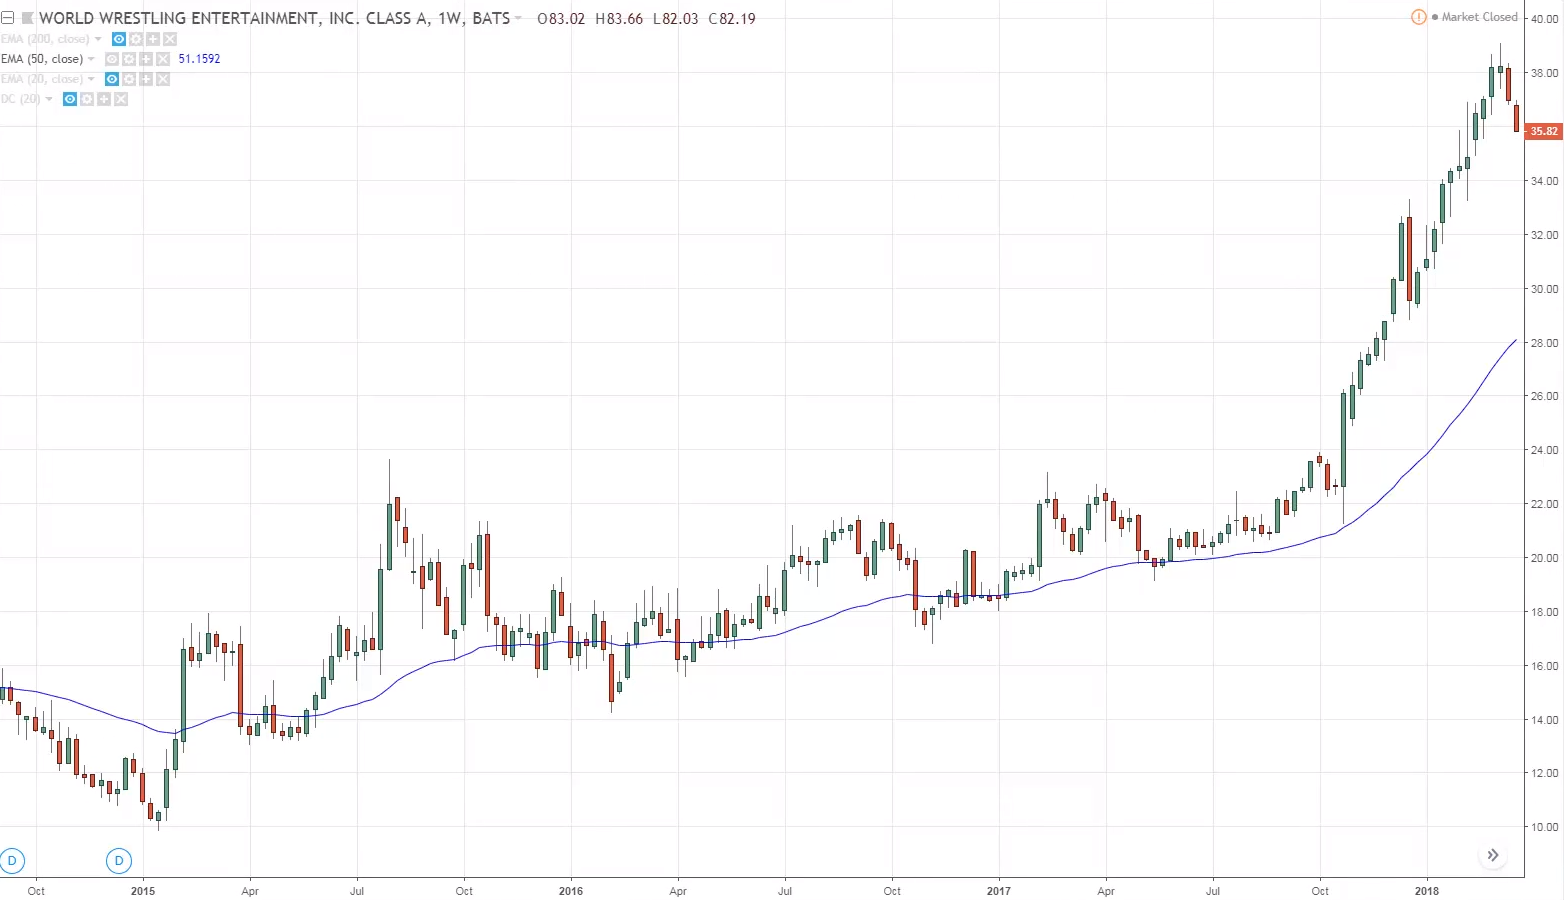
Its current price is also far away from the 50-period moving average.
You can see that if we compare the stocks to the S&P 500:
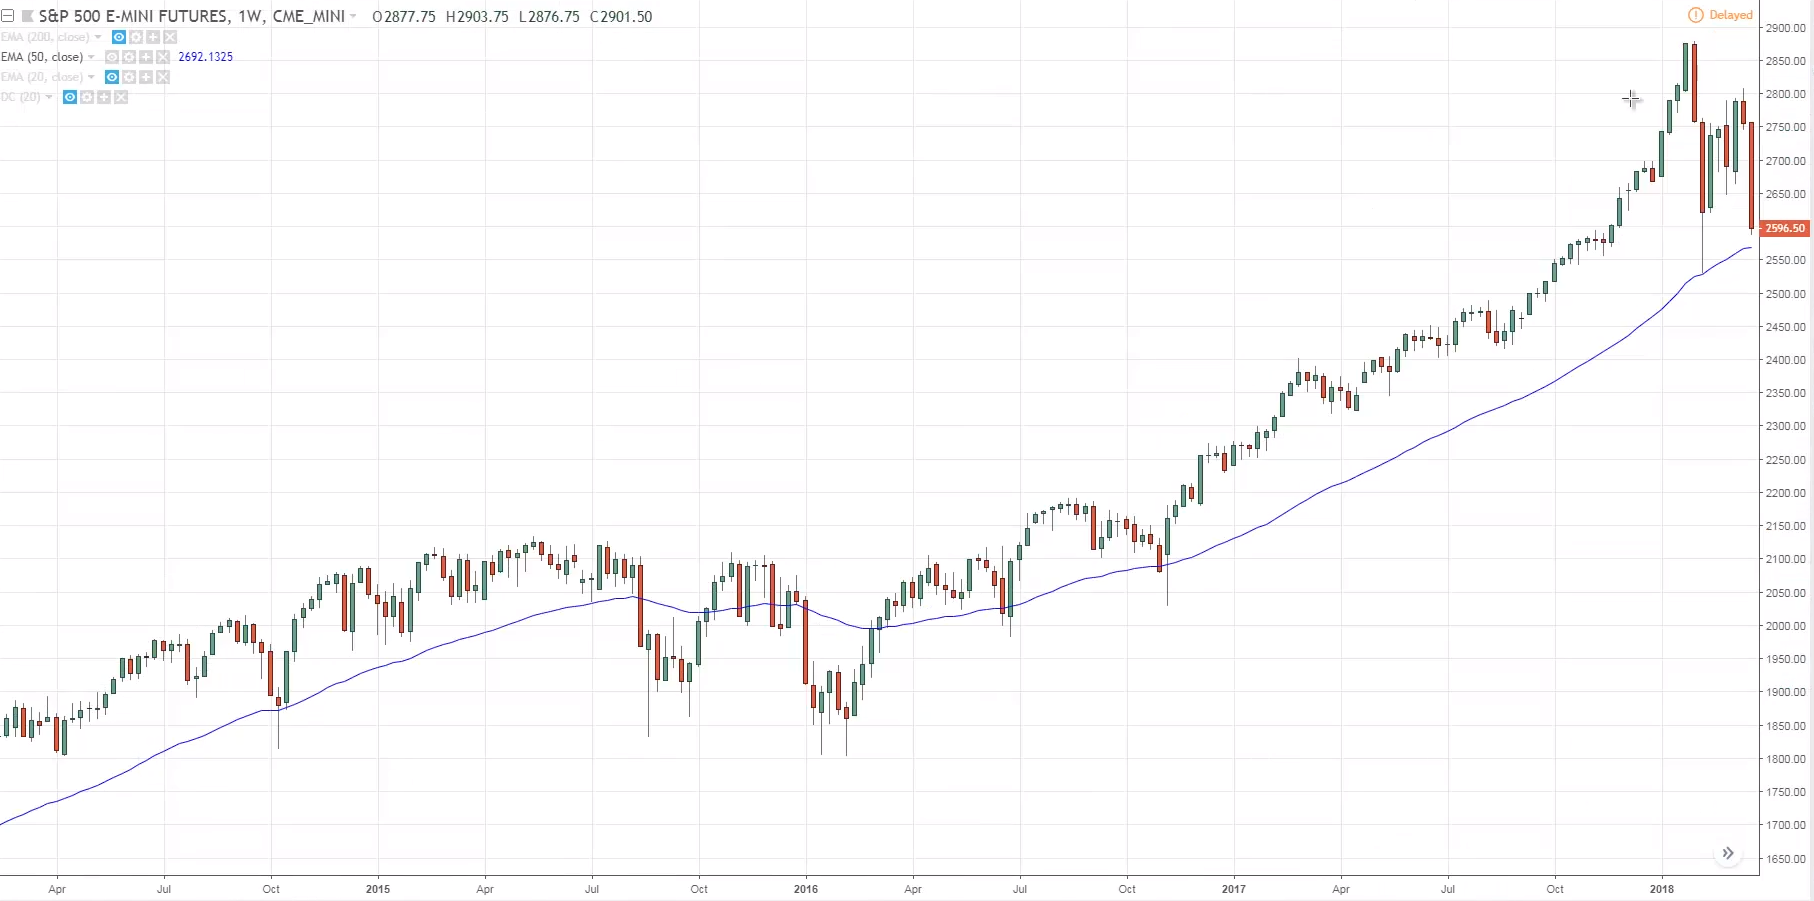
Its current price is almost at the 50-period moving average.
While the other three stocks’ current price is still far from the moving average.
This is a sign of strength because it’s telling you that the three stocks (LULU, BR, WWE) are holding up pretty well!
This is how you can use the moving average technique to identify strong stocks.
The other approach that you can use is to measure the price decline from the highs of the S&P 500.
% Change technique
Let me walk you through with it…
Let’s say the highs of the S&P500 is 2880 and declined all the way to 2600 (Dropped 280):
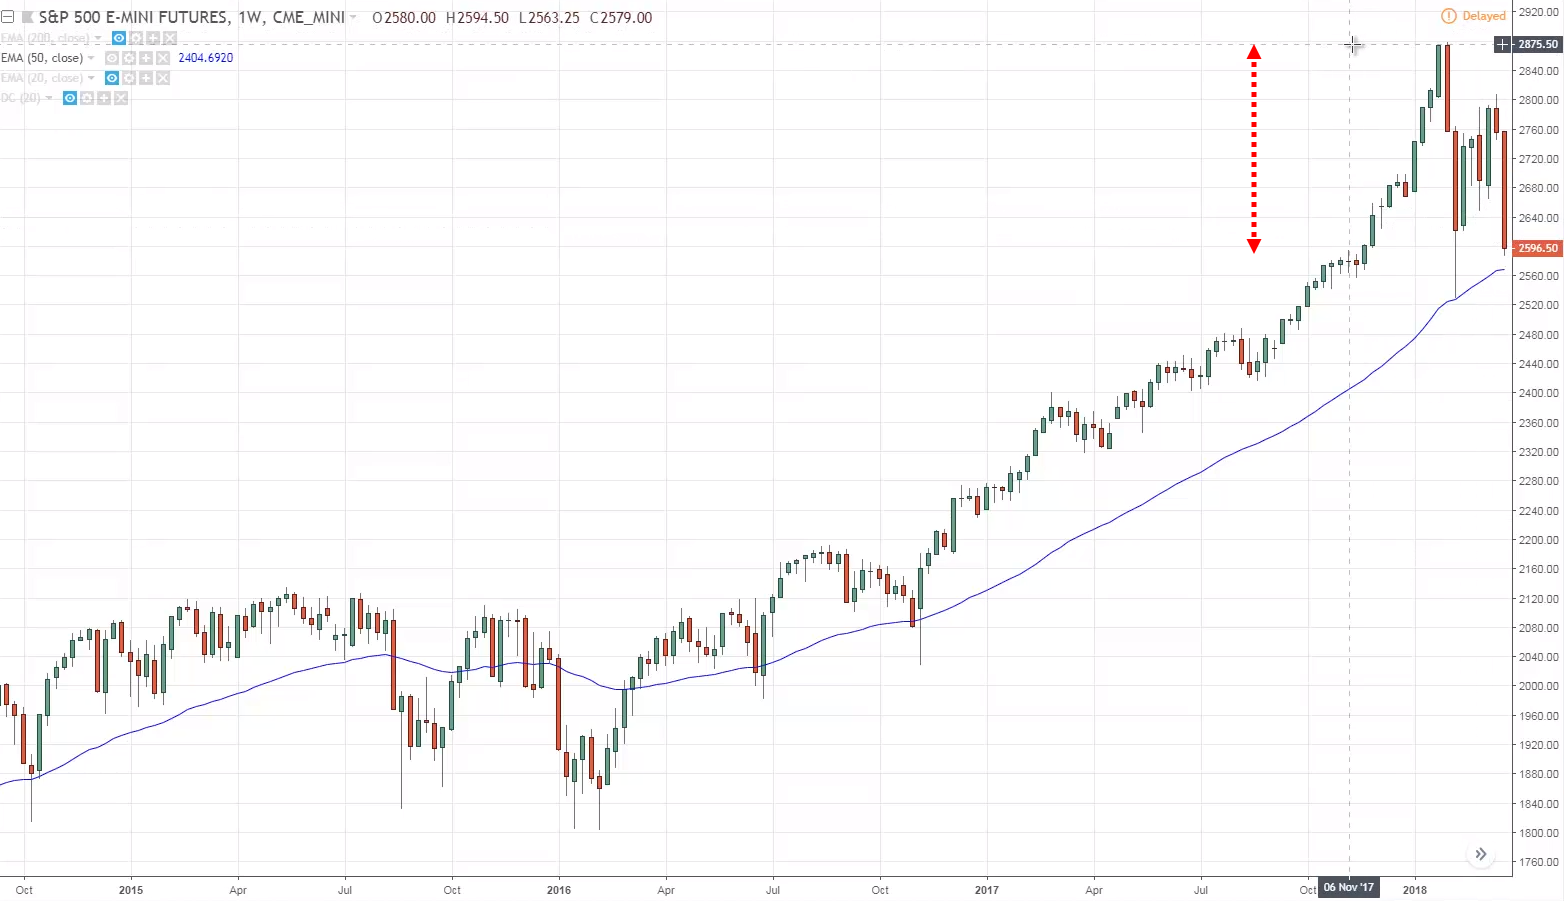
So, 280 points divided by 2880 (the highs).
The decline is about 9.7%
Now, if we look at LULU:
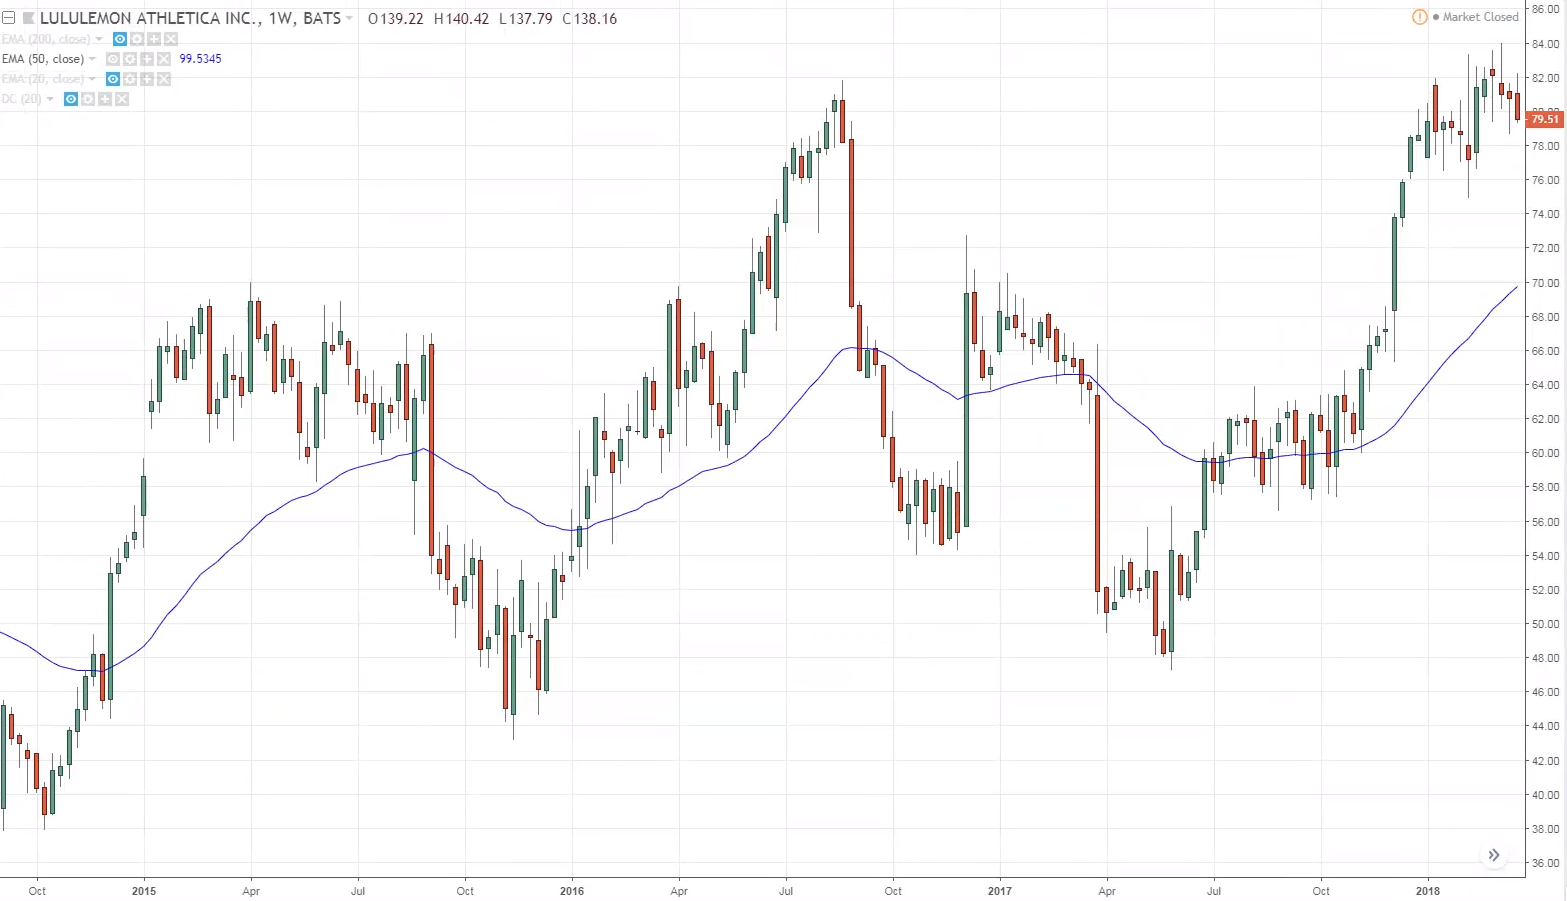
The highs are about 84 and the current price is 78.50 (5.5 difference)
5.5 divided by 84 (highs) shows that the stock made a 6.5% decline only whereas the S&P declined for 9.7%
How about BR?
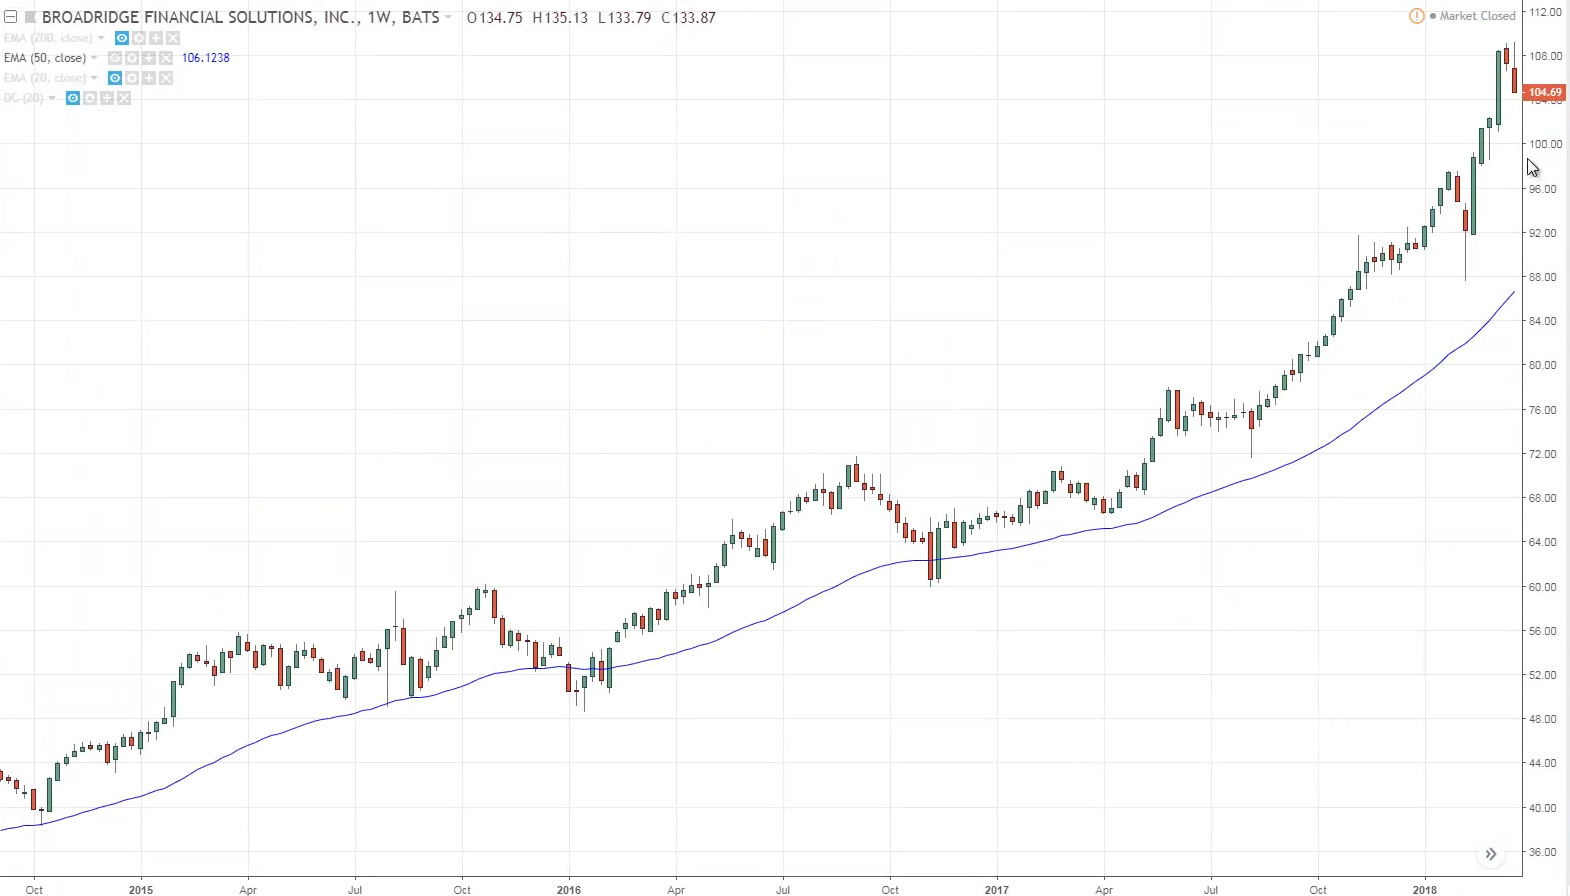
From 109 down to 104, it made a decline of 4.5% only.
And as for WWE:

From 39 down to 36, it made a decline of 7.6%
All in all, what you’ve noticed is that the S&P 500 has declined the most of about 9.7%
Whereas LULU, BR, and WWE…
Their decline is lesser than the S&P 500.
This is another way to track which are the strongest stocks that are holding up well.
Because they don’t fall as much as the S&P 500.
Needless to say, once you have identified these strong stocks and you have a valid trading set-up, you want to be buying these group of stocks.
For example, LULU is forming a buildup over here:
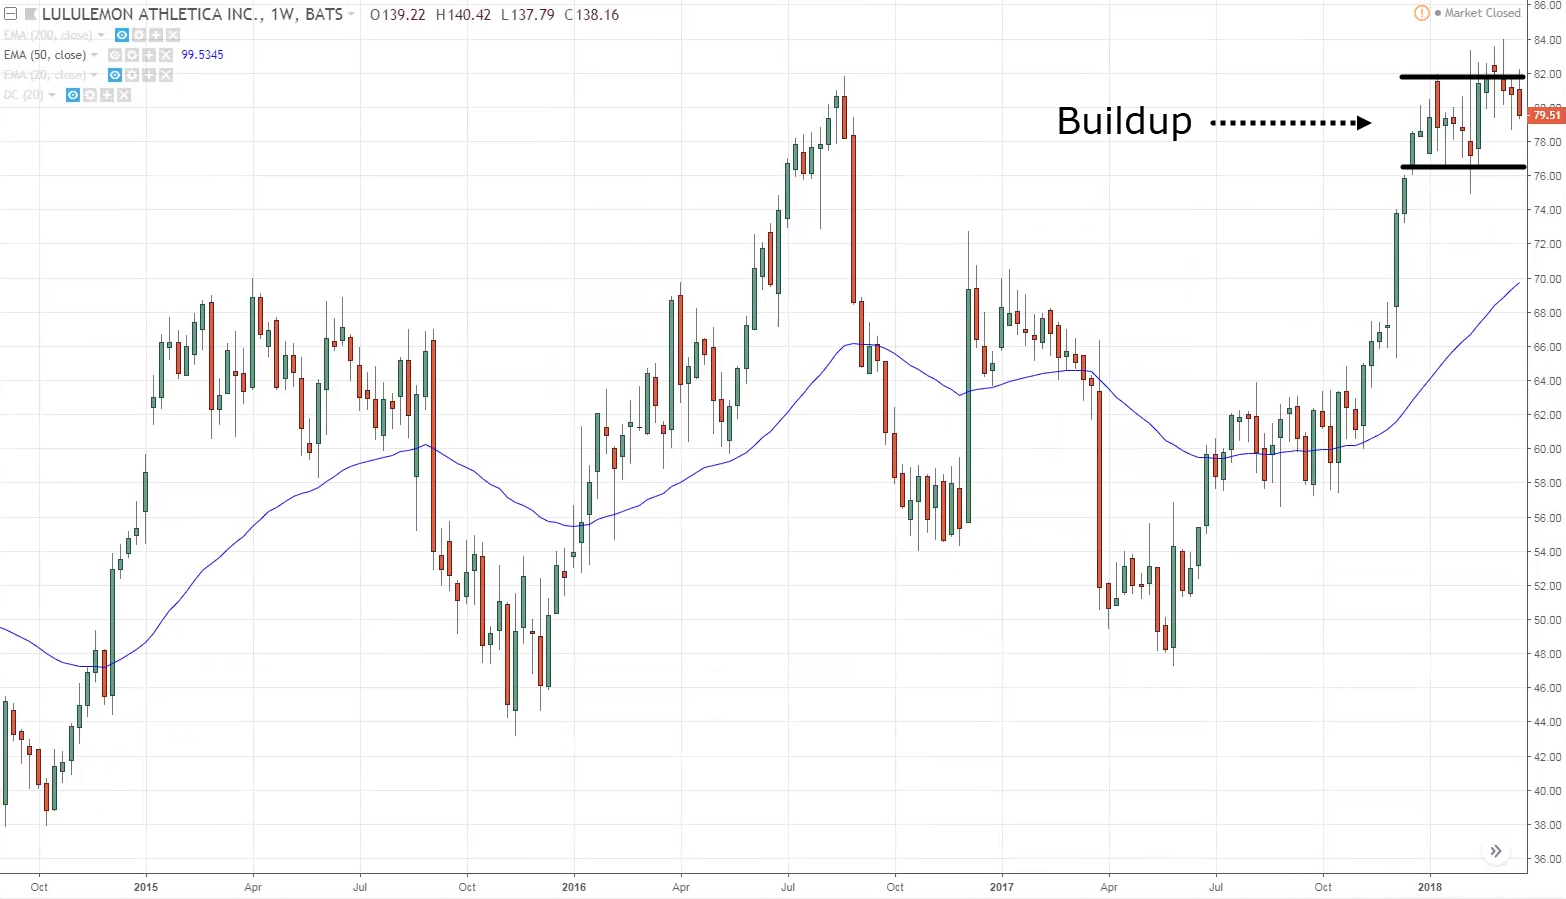
You might be interested to go long on the break of the highs and have 1 ATR stop loss below the previous low.
Afterwards, you can see how LULU moved so much more:
Whereas if you look at the S&P 500:
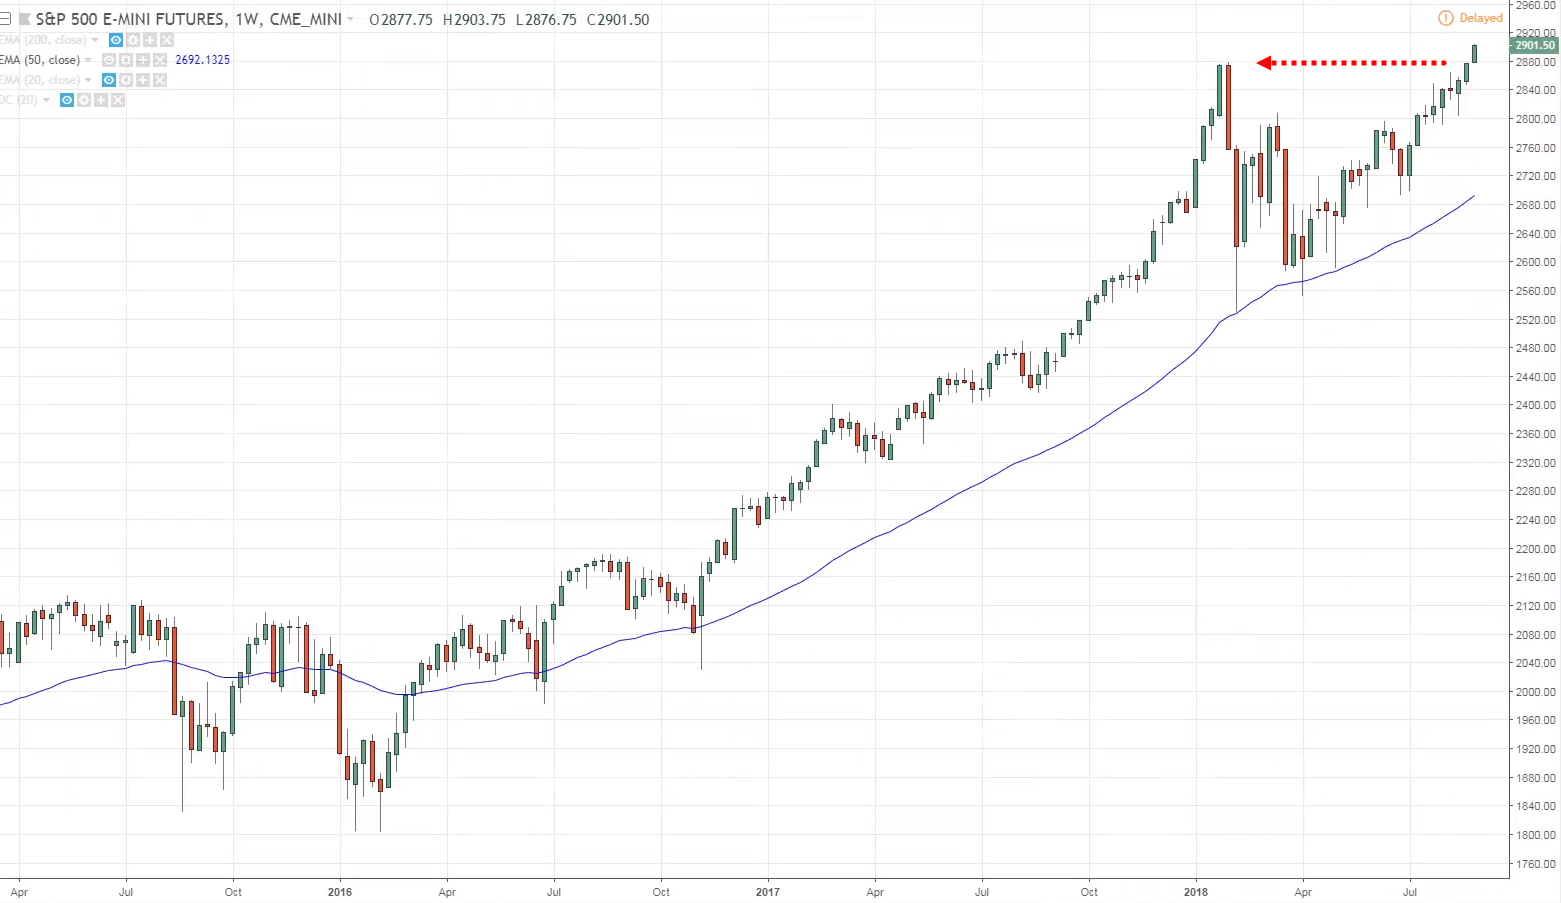
It barely tested its previous high while LULU broke the highs and moved much more.
This is also a similar story for BR:
And also, for WWE:
You can see that if you buy the strongest stocks…
Not only their decline is shallower, but the rally that follows is usually stronger than the stock index itself.
This is important to know which are the strongest stocks that you want to trade.
Here’s a quick recap.
Recap
- Look for a correction in the stock markets
- Identify stocks which are holding well (% change, moving average)
- These are the strongest stocks that are likely to breakout higher
Hey hey, what’s up my friends!
In this video, I will share how you can go about creating your own watchlist when you are trading the stock markets.
Because I know that there are thousands of stocks out there.
How do you know which stock to filter?
How do you know which stocks have your trading setup?
How do you know which stocks to focus on?
Here’s a guideline so you can create your own watch list…
Guidelines on how to create a watch list
The first thing is…
Filter stocks by market capitalization
You won’t be trading all the stocks out there.
Stocks can be categorized into three:
- Large-cap
- Mid-cap
- Small-cap
Which type of market capitalization of stocks you want to trade?
Do you want to trade the bigger stocks out there?
Or would you rather trade the smaller stocks which are more volatile?
This is something that you have to define from the start.
If you want to trade big stocks, you only want to focus on trading the stocks on the S&P 500…
Any stocks outside of the S&P 500 is none of your business anymore.
Define your trading setup (e.g. breakout)
You have to know what you are looking for in the first place!
If you do not know what you are looking for, then you are just aimlessly looking through the charts.
Anything that is moving will capture your attention, and that is usually the worse trades to enter.
So, you want to define your trading setup strictly.
If you want to trade breakouts…
What type of breakouts do you want to trade?
Breakout of the 20-week high?
Or the breakout of the 40-week high?
From then on, you could put in indicators to make your life easier when scanning the markets.
Add all the stocks that meet your criteria to a watchlist
Once you’ve done it, you can start scanning stocks that meet your criteria and add them to your watch list.
For example, you are trading the S&P 500 stocks.
What you’ll do is you’ll look through all of the 500 stocks in the S&P 500 and find those that are closest to having a breakout.
Focus on the stocks in your watchlist
When your watchlist is already populated by a few selected stocks that meet your set-up…
These are the handful of stocks that you want to focus on in the week.
Now, I’ll explain how you can do it…
How to create a watchlist
Currently, I am using tradingview:
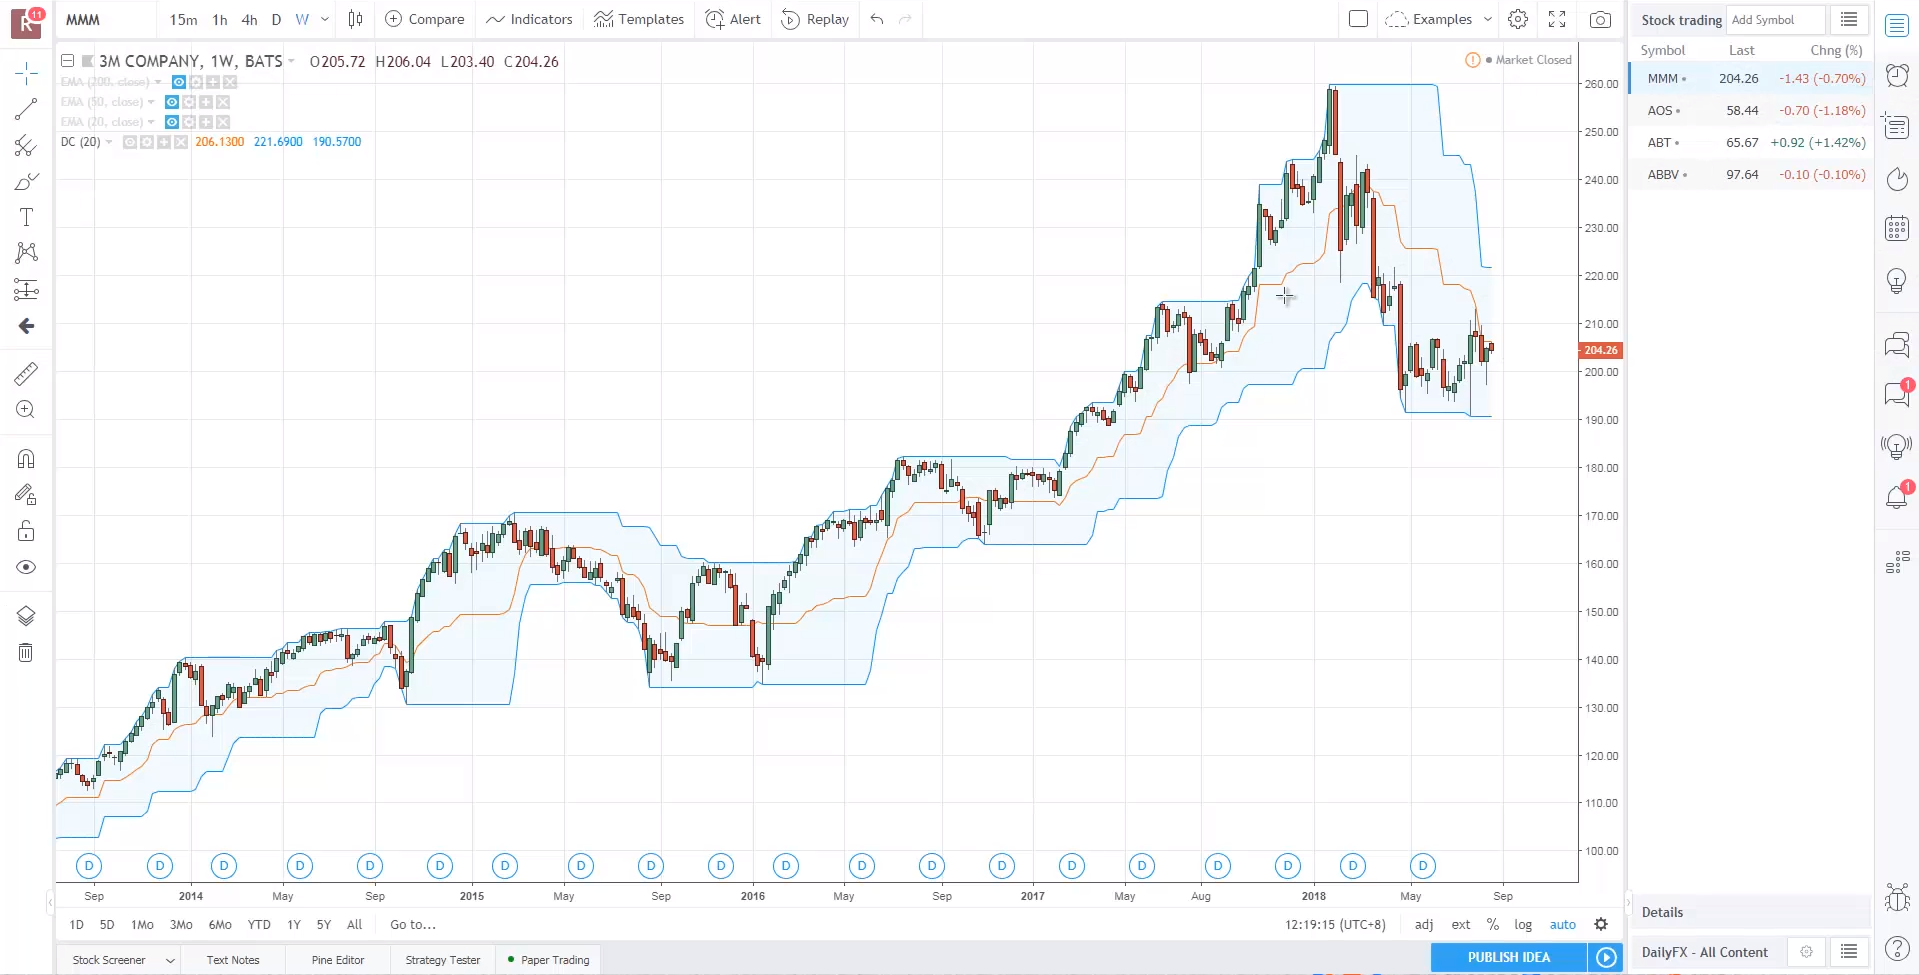
It’s free, but you can also use your own software.
Again, it doesn’t matter, the concept is what matters.
So, you want to create a separate watchlist for stock trading:
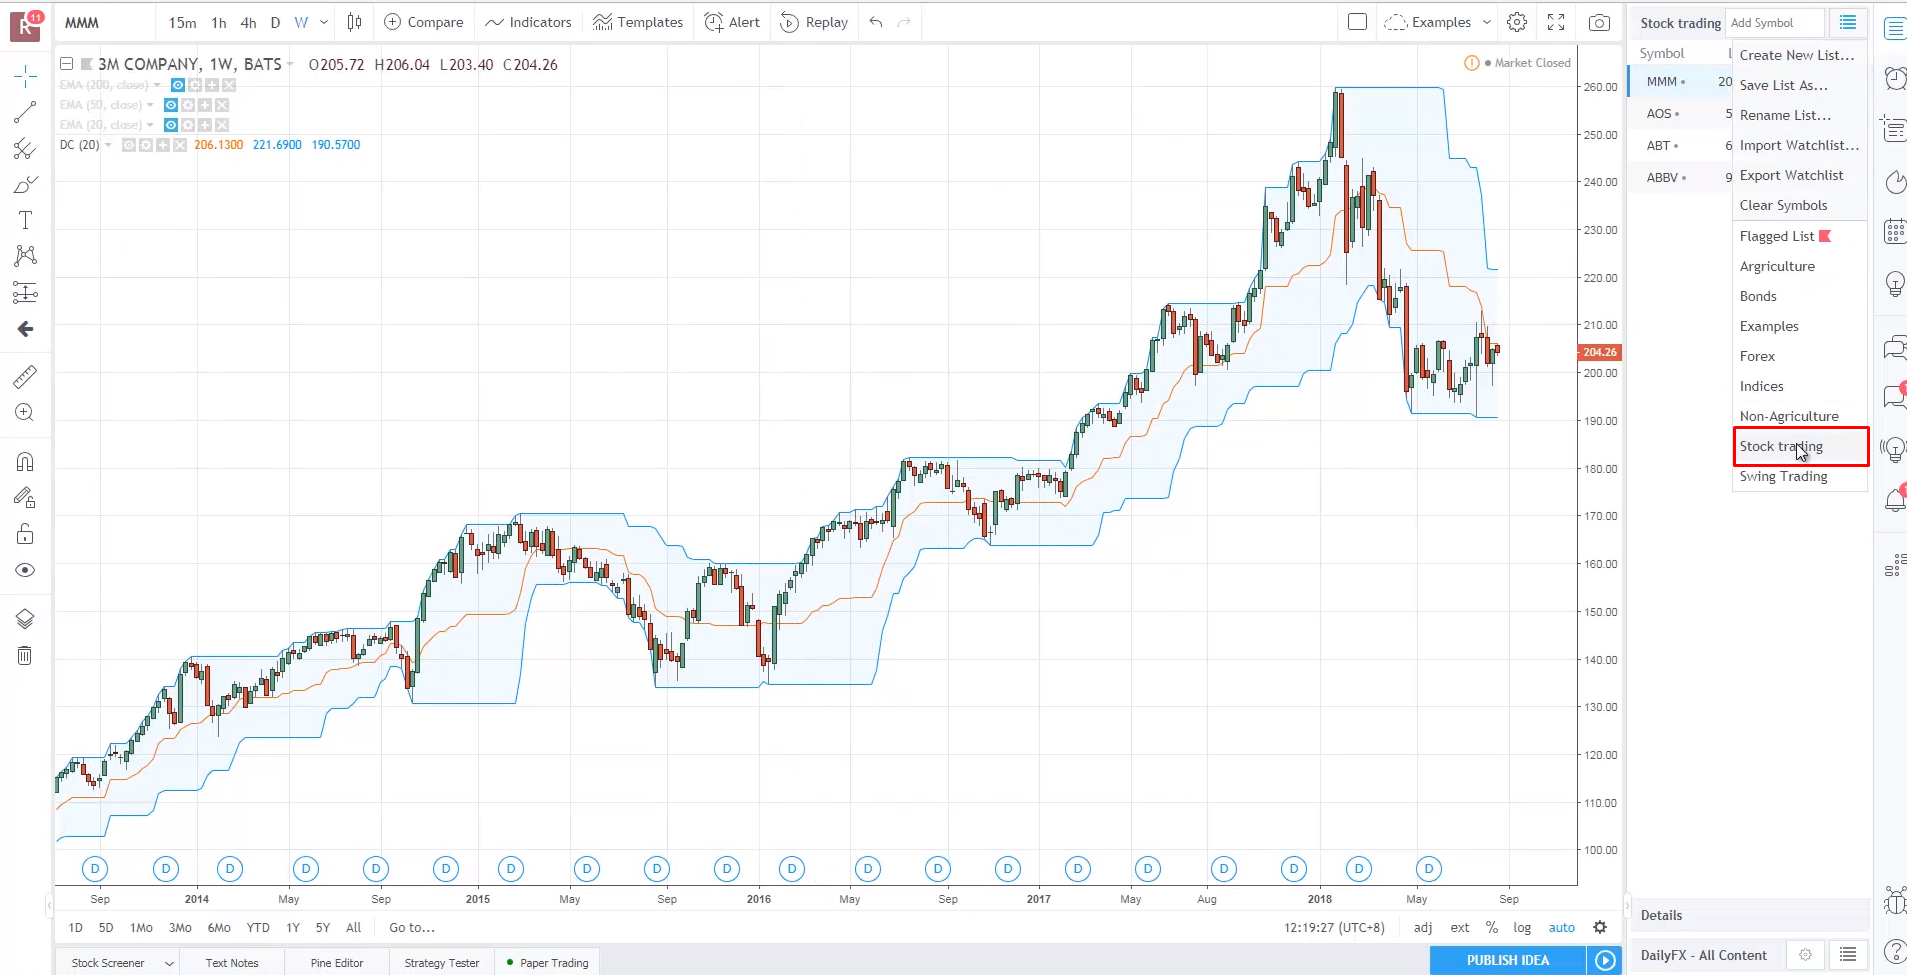
Since you are trading all the S&P 500 stocks…
You can go to the website over here that shows you all the 500 stocks in the index:
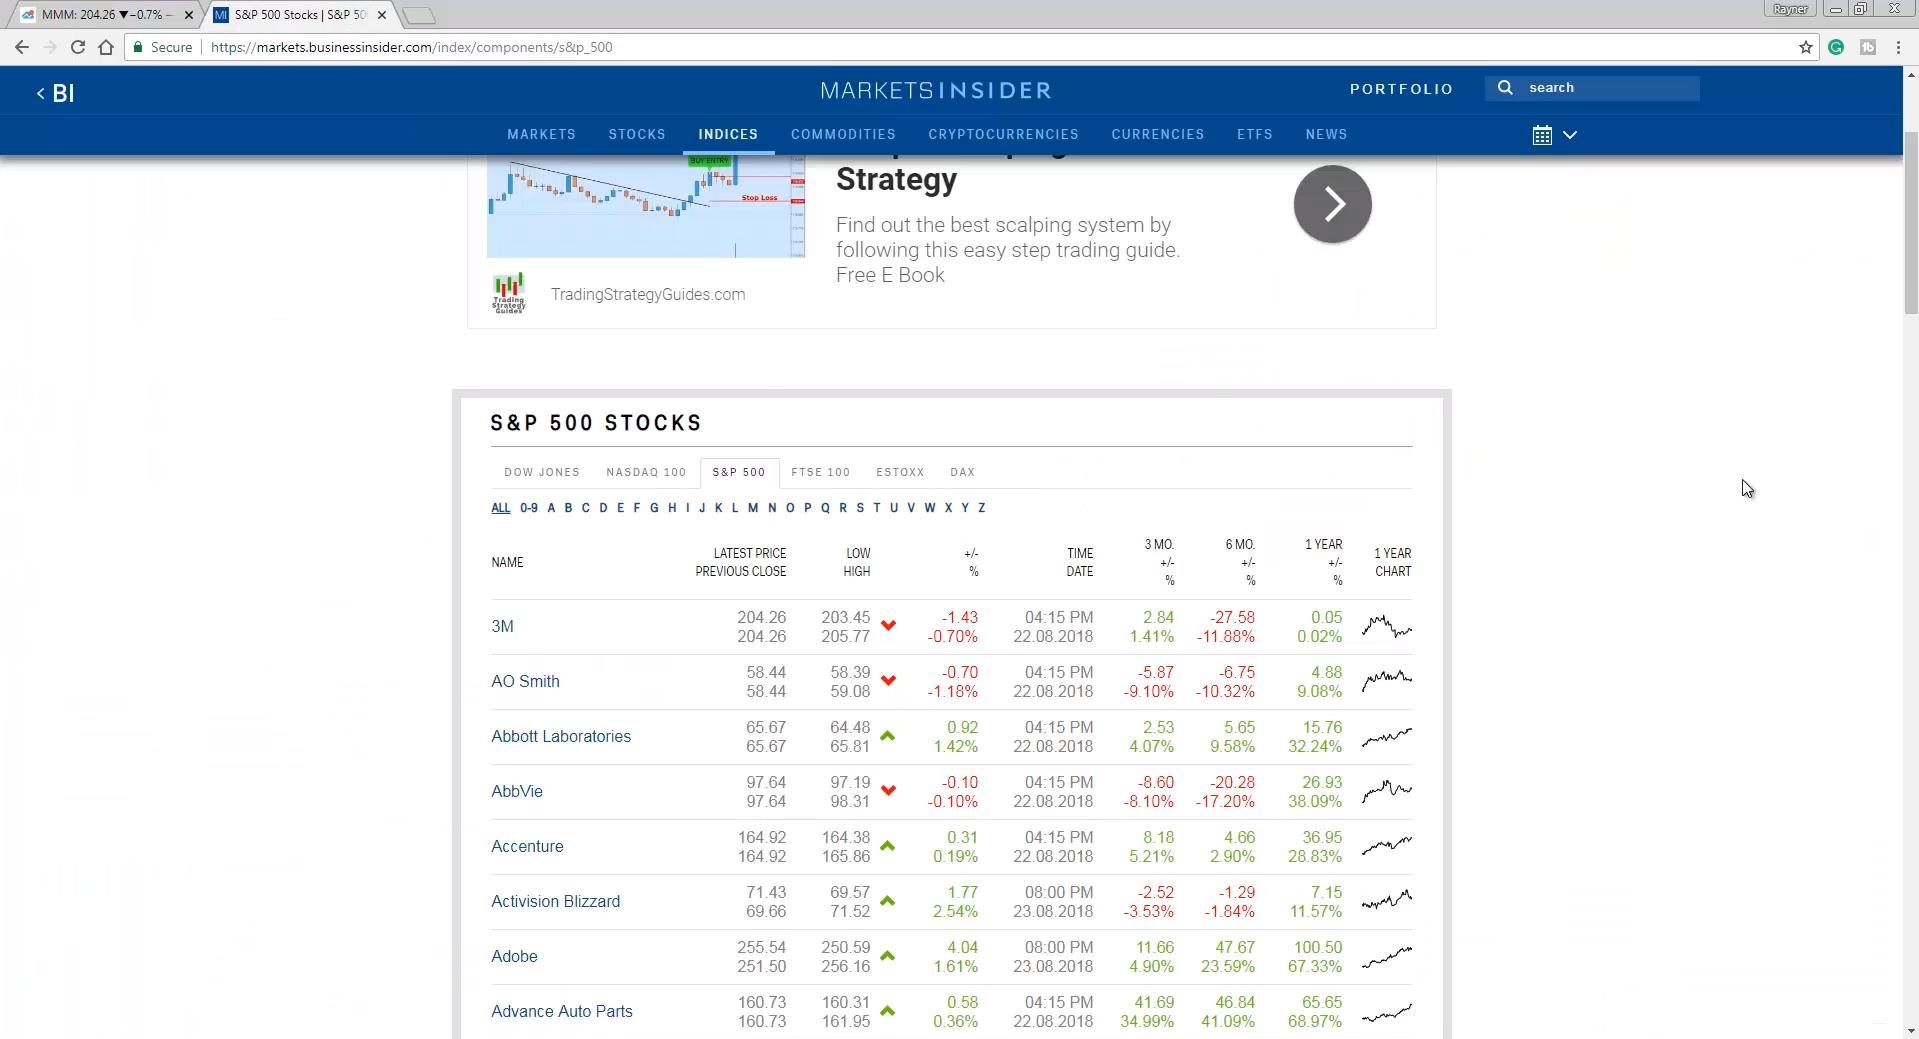
Then, what you want to do is to add all of the stocks in your own personal watchlist.
The reason why you want to do this is that once you are scanning the markets for your set-ups…
It’s much easier to click and switch charts on the 500 stocks on your watchlist in tradingview rather than entering stock codes manually every day:

Once you’ve added all the 500 stocks in your watch list…
The next thing you want to do is to look for your trading set-up!
This is something that you should have already defined ahead of time before entering a trade.
For example, we want to trade the breakout of the 20-week high.
One useful indicator is the Donchian Channel:

The upper blue line shows the 20-week high, and the lower blue line shows the 20-week low!
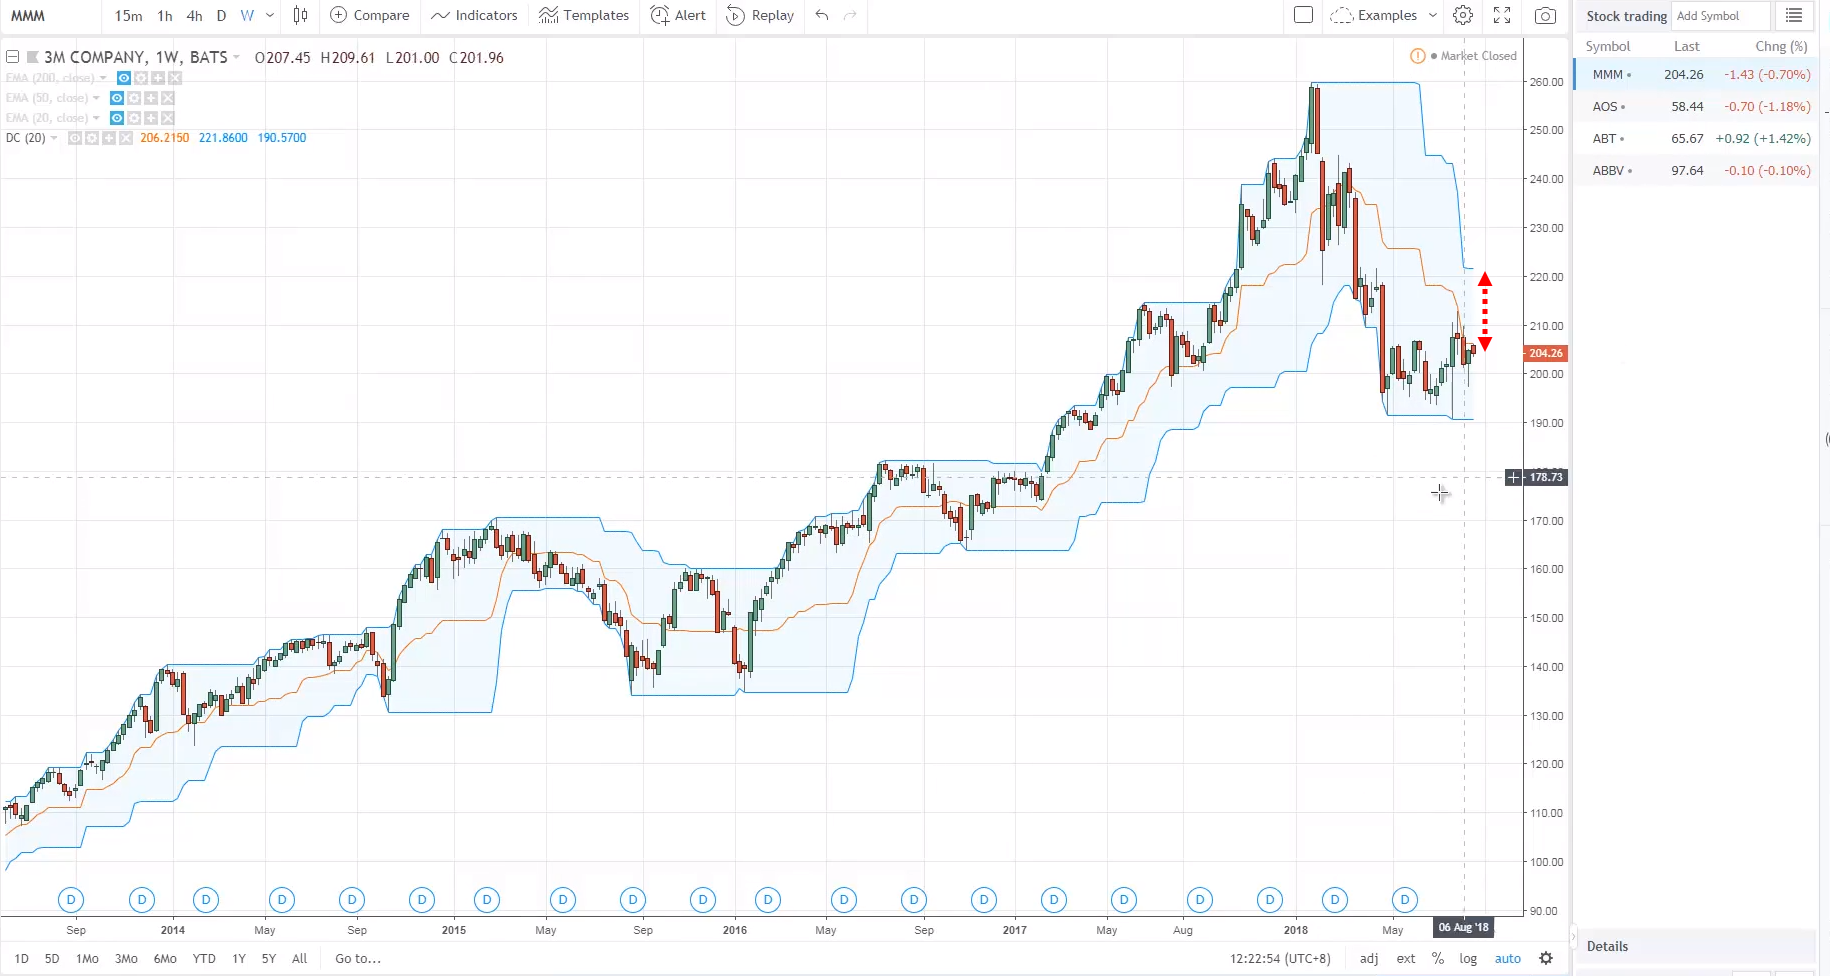
Since we are looking to trade the breakout of the 20-week high…
Let’s look through our watchlist and see which are the ones that are already near to its 20-week high.
For MMM, its current price is far from the 20-week high:
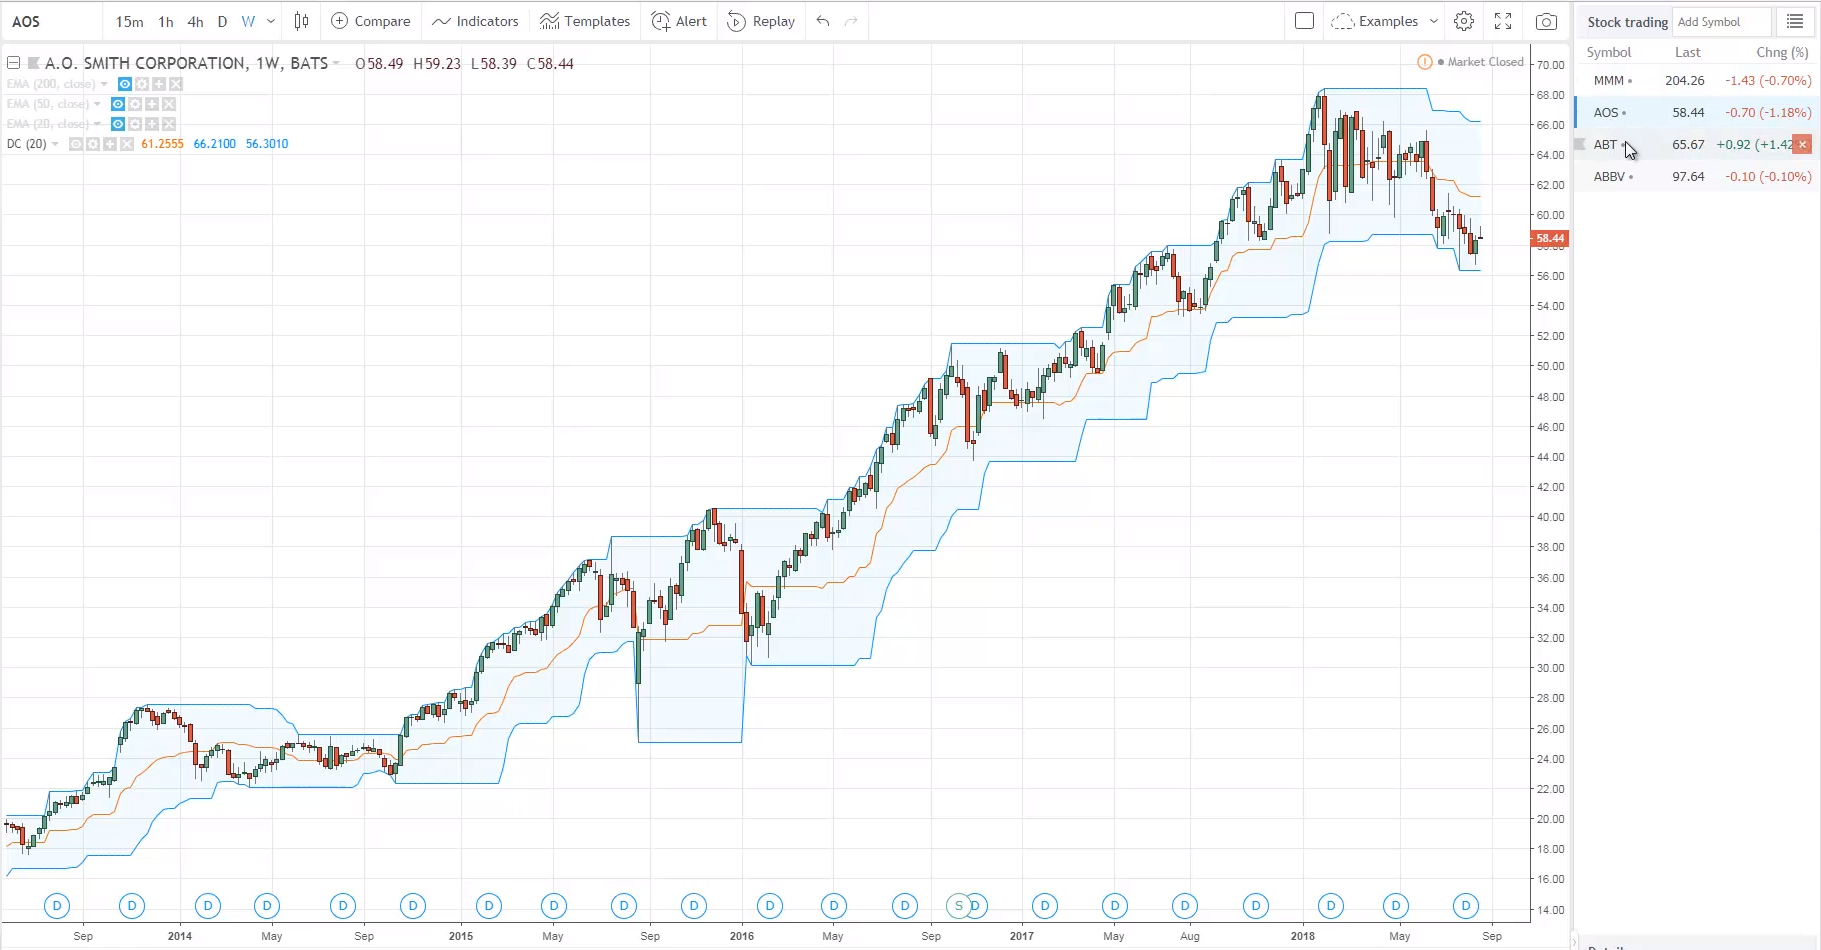
For AOS, its current price is also far from the 20-week high:
As for ABT, its current price is already near the 20-week high:
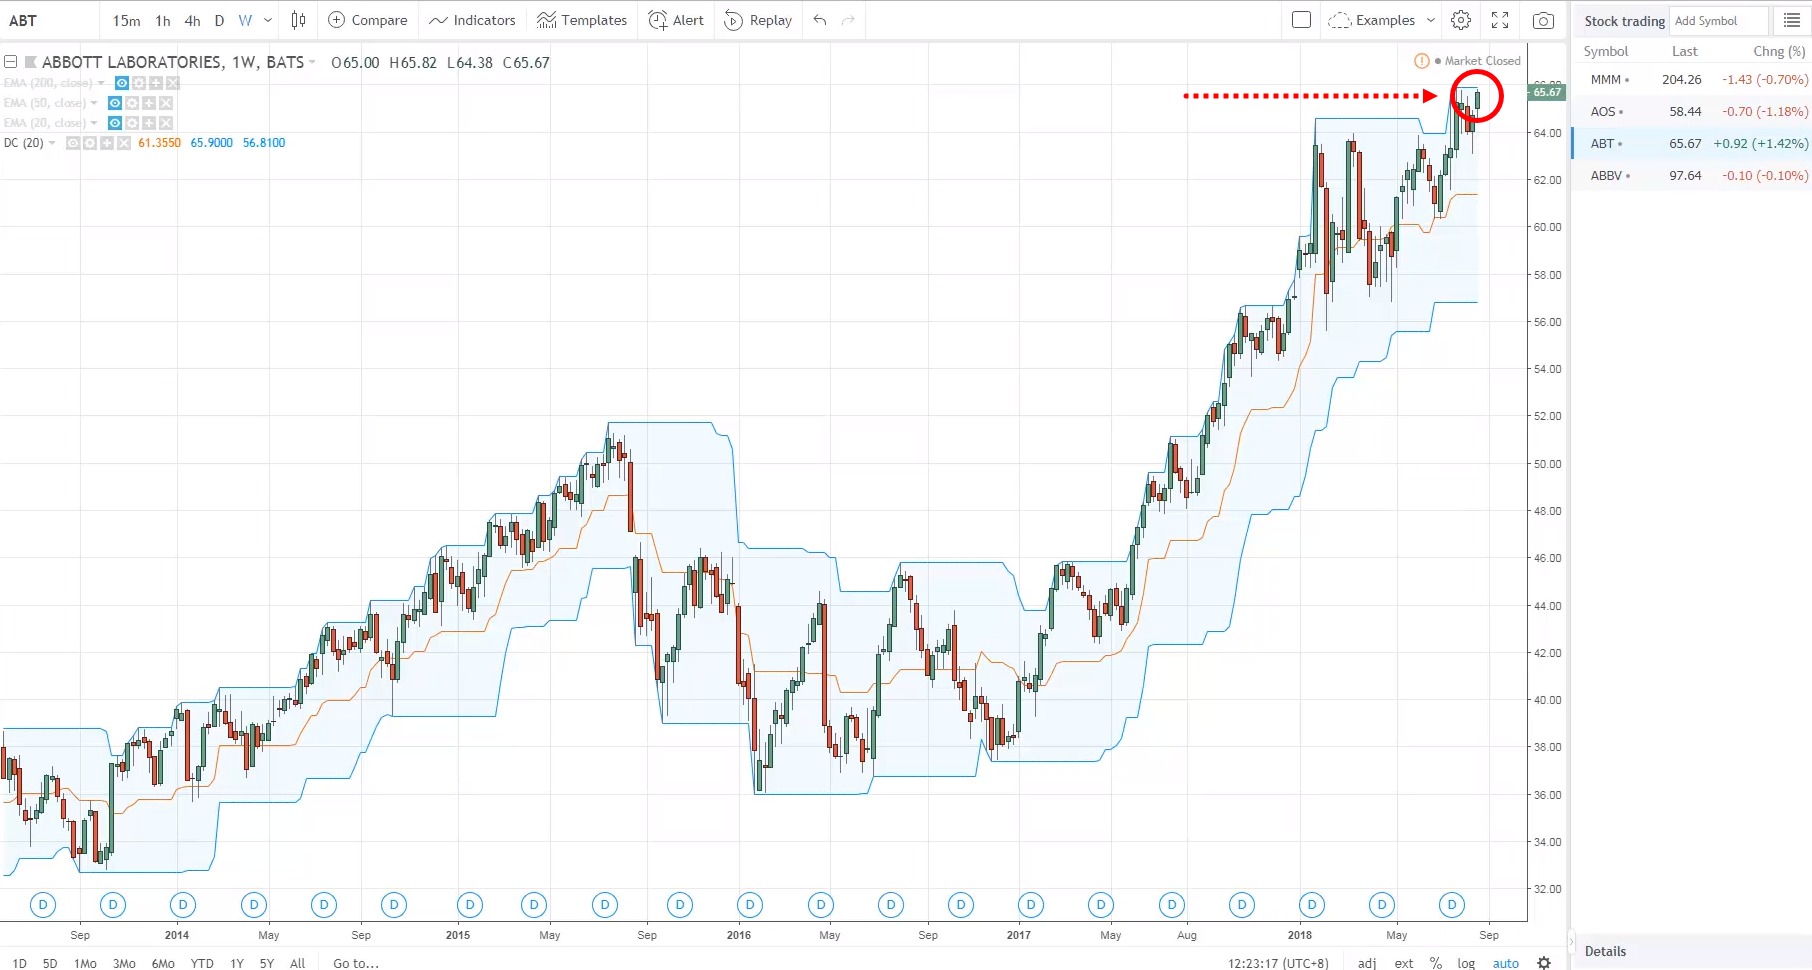
This is a stock that we want to pay attention to this coming week.
What you can do is pull out your excel spreadsheet and put in the symbol to your trading setup:

You should also be able to populate the other rows in the spreadsheet as you look through all of the 500 stocks.
This way, when the market opens this coming week, you know that these are the stocks in your spreadsheet that you want to focus on.
So that you don’t have to constantly look at your main watchlist of 500 stocks and check them every day.
This is how you go about creating a watchlist of stocks that you want to trade in the coming week.
Recap
- Filter your stocks by market capitalization
- Define your trading setup (e.g. breakout)
- Then add all the stocks that meet your criteria to a watchlist
- Pick all the 500 symbols in the S&P 500 to your main watchlist
- Look for trading setups and place the selected stocks in your focus watchlist
- Focus on the stocks in your focus watchlist
This is the homework that you have to do as a trader.
There is really no shortcut.
However, you can use tools like finviz for stock screening.
If you trade in the Philippine stock markets, you can use Investagrams’ Investa screener.
If these tools are not available in the stocks you are trading…
Then you would have to do it manually based on the guidelines I have shared with you.
With that said…
I have come to the end of this lesson, and I will see you in the next.
Hey hey, what’s up my friend!
We have come towards the end of the Advanced Stock Trading course.
The conclusion of the Advanced Stock Trading course
At this point in time, you probably have many ideas, techniques, and strategies in your head.
Trying to apply them into the markets!
But one thing to share is that you don’t have to apply everything at once.
Because I know that there’s quite a number of things that I have shared with you.
And if you try to apply it all at once…
You may be overwhelmed.
My suggestion is that you go with the techniques that make the most sense to you.
For example, if you trade breakouts…
Then you might want to try to trade breakouts with buildup.
Because as I’ve shown you, those type of breakout trades are more profitable with lower risk!
Or perhaps you just can’t seem to find a good trade, your trades are usually losers.
What you can do is apply a trend filter to your trades and see if it increases your winning rate.
Okay?
Those are a couple of things to share with you to get you started.
With that said, thank you for your time, and I will talk to you soon!