
Download: Video | Transcript
Hey hey, what's up my friend!
In this module, you’ll learn about the Power Stock Trading System.
What is it
A trading system that seeks to ride trends in the stock markets.
Why it works
The stock market is generally in a long-term uptrend.
Because the economy tends to do well over time, businesses also make more profit over time.
No doubt we’ve had a few financial crises.
But if you look at the big picture, we’re in a long-term uptrend in the stock market.
So you’ll look to buy stocks in this long-term uptrend.
You’ll be buying the best-performing stocks and hold them for until the trend ends.
This is what the Power Stock Trading System is all about.
Who it’s for
This is for you if you’re the type of trader who:
- Wants to focus on buying the strongest stocks to ride the trend for all it’s worth
- Can check the charts at least once per week
This is for you if you don’t want to be actively trading the markets every day.
If you can trade once per week on a Monday – this trading system is for you.
With that, I’ve come towards the end of this lesson.
I'll see you in the next!
Download: Video | Transcript
Take note that you will trade stocks within the Russell 1000 but use the Russell 3000 to determine whether you should stay in cash or not
The PST Rules You Must Know
These are the rules of the Power Stock Trading System:
- Enter/exit trades every Monday
- Russell 3000 must be above the 100-week moving average (or else remain in cash)
- Buy stocks that break and close above the 40-week high
- Pick the top 10 stocks that have the highest ROC values over the last 50 weeks
- Trailing stop loss of 30% from the highs
- Exit all positions if the Russell 3000 closes below the 100-week moving average
Let me explain.
1. Enter/exit trades every Monday
This is a weekly trading system.
Your trades will be entered and exited every Monday when the market opens.
2. Russell 3000 must be above the 100-week moving average (or else remain in cash)
You’ll reference the Russell 3000 to see how the broad-based market is doing.
If the Russell 3000 Index is above the 100-week moving average, you can conclude that the overall market is bullish.
So you want to be buying stocks.
if the Russell 3000 Index is below the 100-week moving average, you’ll then hold cash.
3. Buy stocks that break and close above the 40-week high
In other words, you’re buying breakout stocks over here.
And sometimes when you trade this breakout stocks, there are many stocks to choose from.
Maybe there are 50, 100 or 200 stocks all breaking out of their 40-week high.
So which stocks do you choose?
What you’ll do is this…
4. Pick the top 10 stocks that have the highest ROC values over the last 50 weeks
You’ll pick the top 10 stocks that have increased in price over the last 50 weeks.
This is how you will filter out the stocks if there are too many to choose from.
5. Trailing stop loss of 30% from the highs
The trailing stop loss is quite simple.
Let’s say a stock breaks out of its 40-week high, at $100.
Your trailing stop loss will be 30% from the high, so your trailing stop loss is at $70.
If the stock moves up higher, let's say it goes up to $200.
Now your trailing stop loss will be shifted up higher.
So 30% of $200 is $60.
And $200 - $60 = $140.
Or you can use $200 multiplied by 0.7 to get $140.
Your trailing stop loss has now shifted to $140.
You’ll continue holding onto the stock if your trailing stop loss is not hit.
Else, you’ll have to:
6. Exit all positions if the Russell 3000 closes below the 100-week moving average
You’ll exit all your positions regardless of whether your 30% trailing stop loss has been hit or not.
So you can imagine this is like a trend filter:
- If Russell 3000 is above the 100-week MA, you have permission to buy and hold stocks
- If Russell 3000 is below the 100-week MA, you’ll exit ALL your positions
Next…
Risk management
The rules for Risk Management are:
- Maximum of 10 positions (no new trades if all positions are maxed out)
- Risk 10% of your capital per trade
Here’s why….
1. Maximum of 10 positions (no new trades if all positions are maxed out)
If you’ve bought 10 stocks, you’ll not enter any more trades.
Because the number of positions that you can take on is already maxed out you.
2. Risk 10% of your capital per trade
This means that if you have a $100,000 trading capital, you can only buy $10,000 worth of each company’s stock.
So the maximum value of one stock will only be $10,000 worth of shares.
With that said, I’ve come towards the end of this lesson.
In the next lesson, I'll walk you through an example of how this trading setup looks like.
I'll see you there!
Download: Video | Transcript
In this lesson…
I’ll walk you through on the setup of the Power Stock Trading System.
You don't actually have to scan each chart for this particular trading setup.
Because later I'll share with you a systematic approach to scan really quickly.
But still, I want to share with you the actual trading setup.
So that in future if you run the scans and find that something's not right, you can always manually analyse the charts.
Power Stock Trading System Chart Example
If you recall, the trading setup is:
- The stock market index, Russell 3000 has to be above the 100-week MA.
- You’ll go long if the price breaks and close above the 40-week high
Now let's assume that the Russell 3000 is above the 100-week moving average.
This means that you have permission to buy.
What you’re looking for is a break and close above the 40-week high.
Finding the 40-week high
You can use a tool like the Donchian Channel.
You can see that there's an upper channel line, middle and lower.
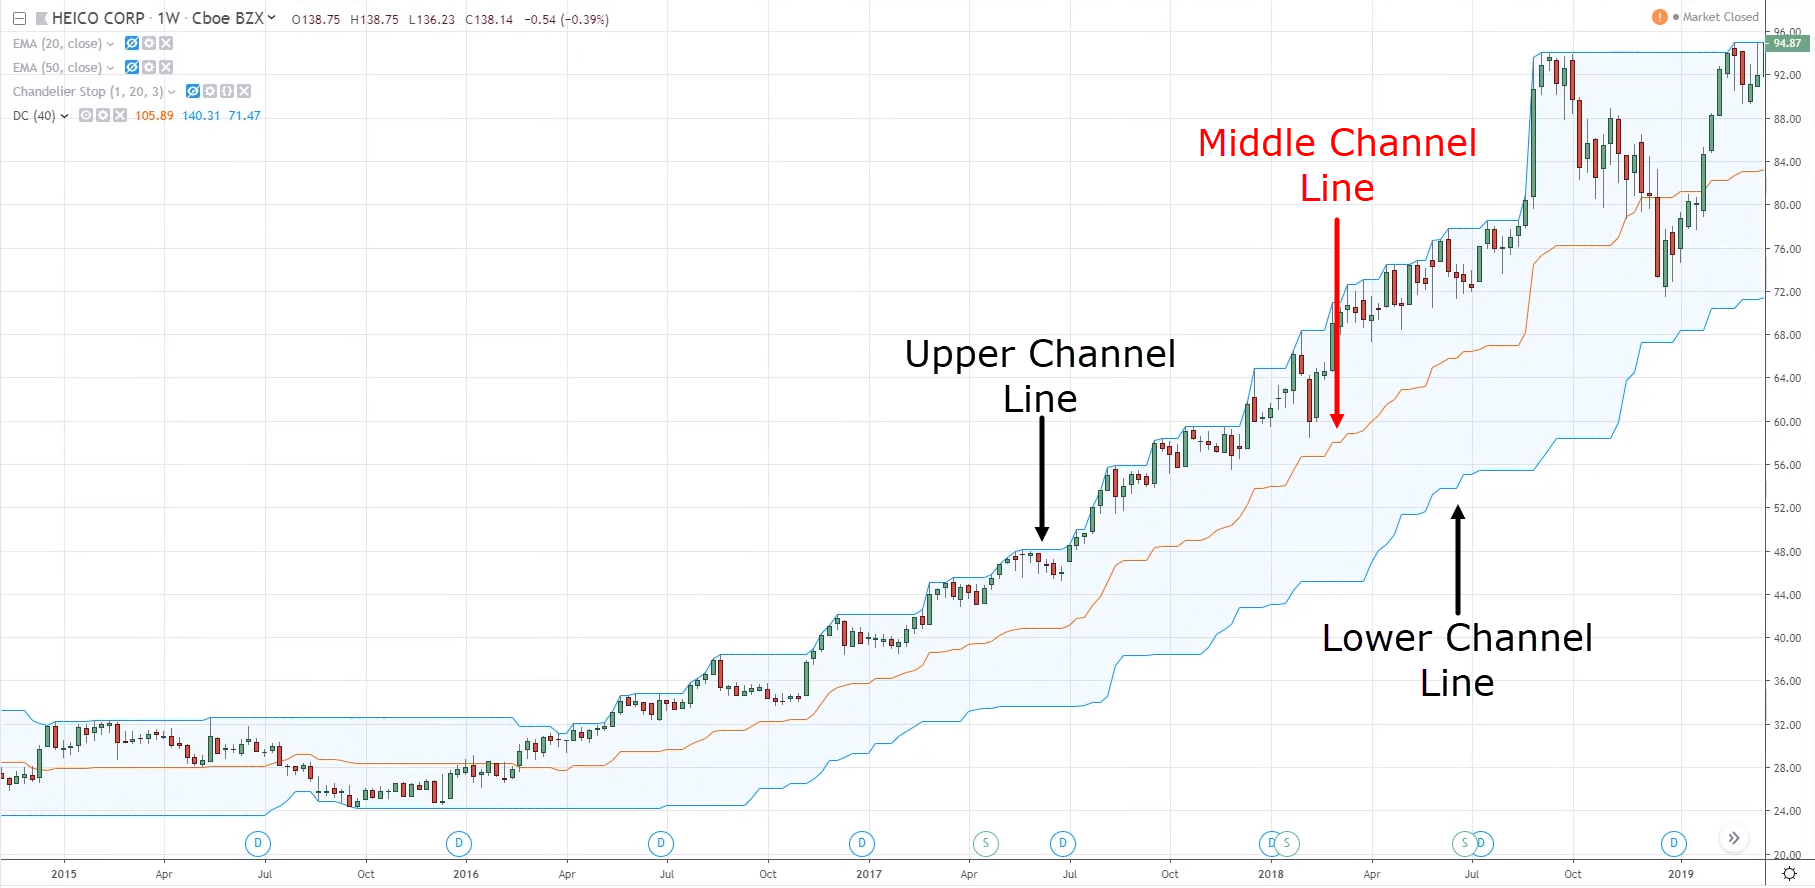
You’ll look at the upper line because it tells us where the 40-week high is.
Adjust its length to 40.

And it’ll tell you where the 40-week high is.
You can see that this blue line is the current 40-week high.
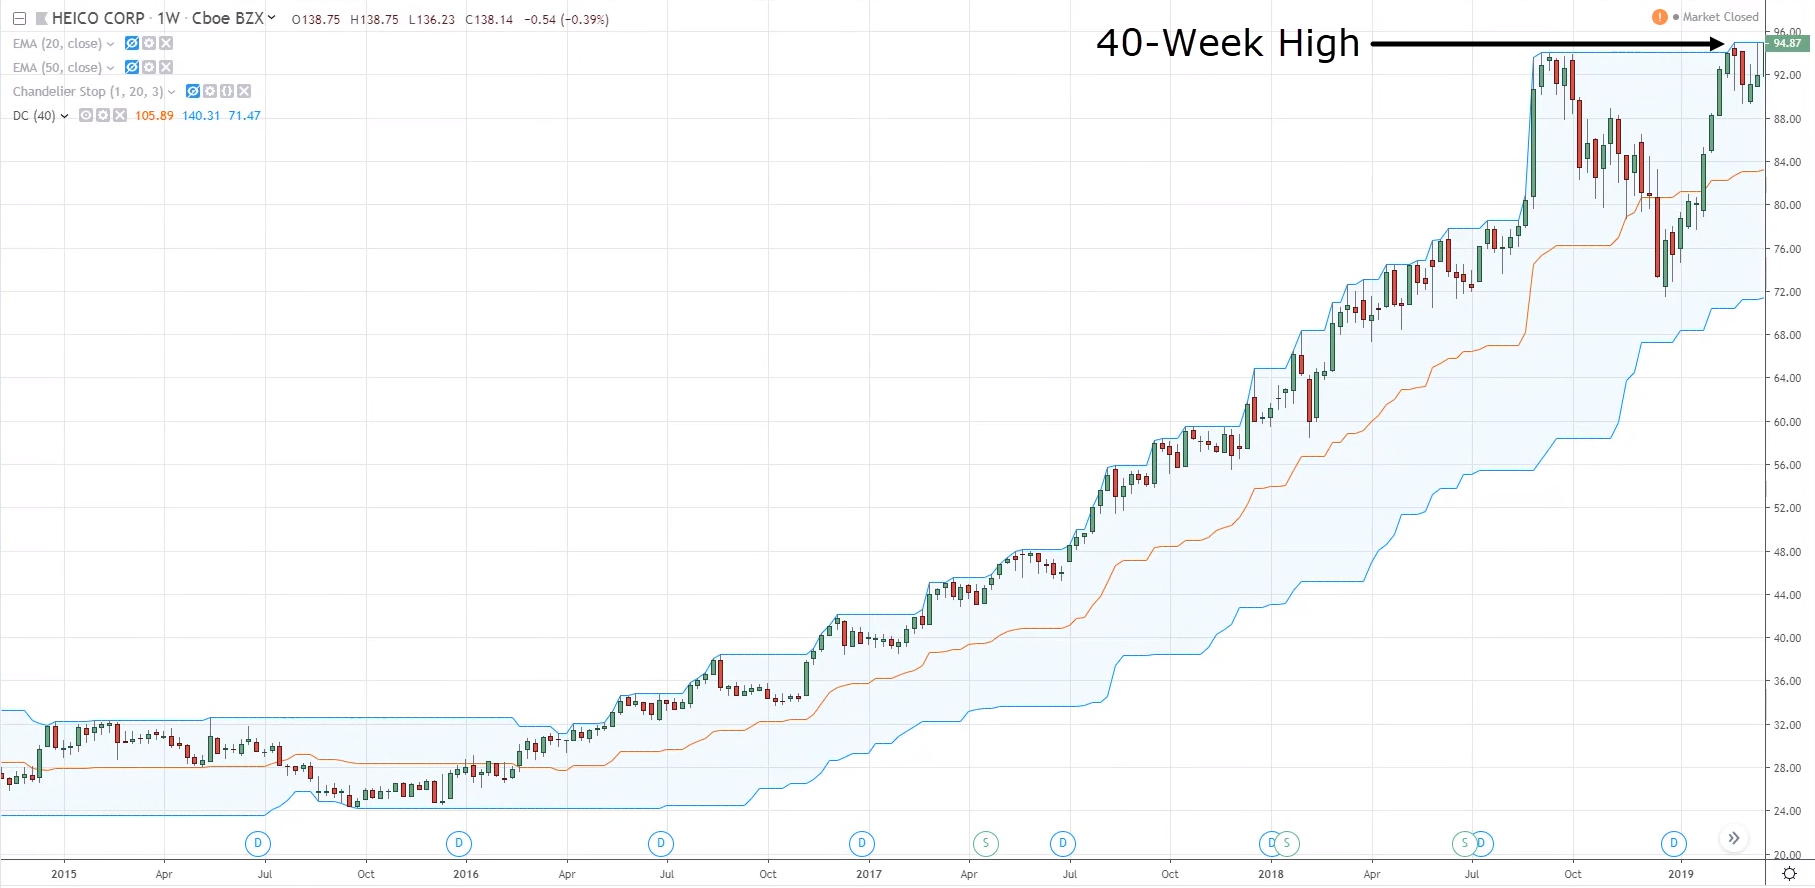
You’ll be looking for the market to break and close above this 40-week high.
On the following week, the market broke and closed above that previous 40-week high.
You’ll not look at the current 40-week high.
Because if you do, then you’ll never get into the trade.
Instead, you’ll look at the previous 40-week high.
Since the price has closed above it, now you have the permission to buy.
Filtering the stocks with Rate of Change indicator
Sometimes you might get too many stocks to choose from.
What if there's like 500,000 stocks?
You can't be buying all these stocks, right?
Because you’ll only have a maximum of 10 positions.
So what you'll do is to this:
Use the Rate of Change indicator and buy the stock that has moved the most over the last 50 weeks.
Pull up the ROC indicator and set its length to 50 weeks.

The ROC for this one here is at 40%.
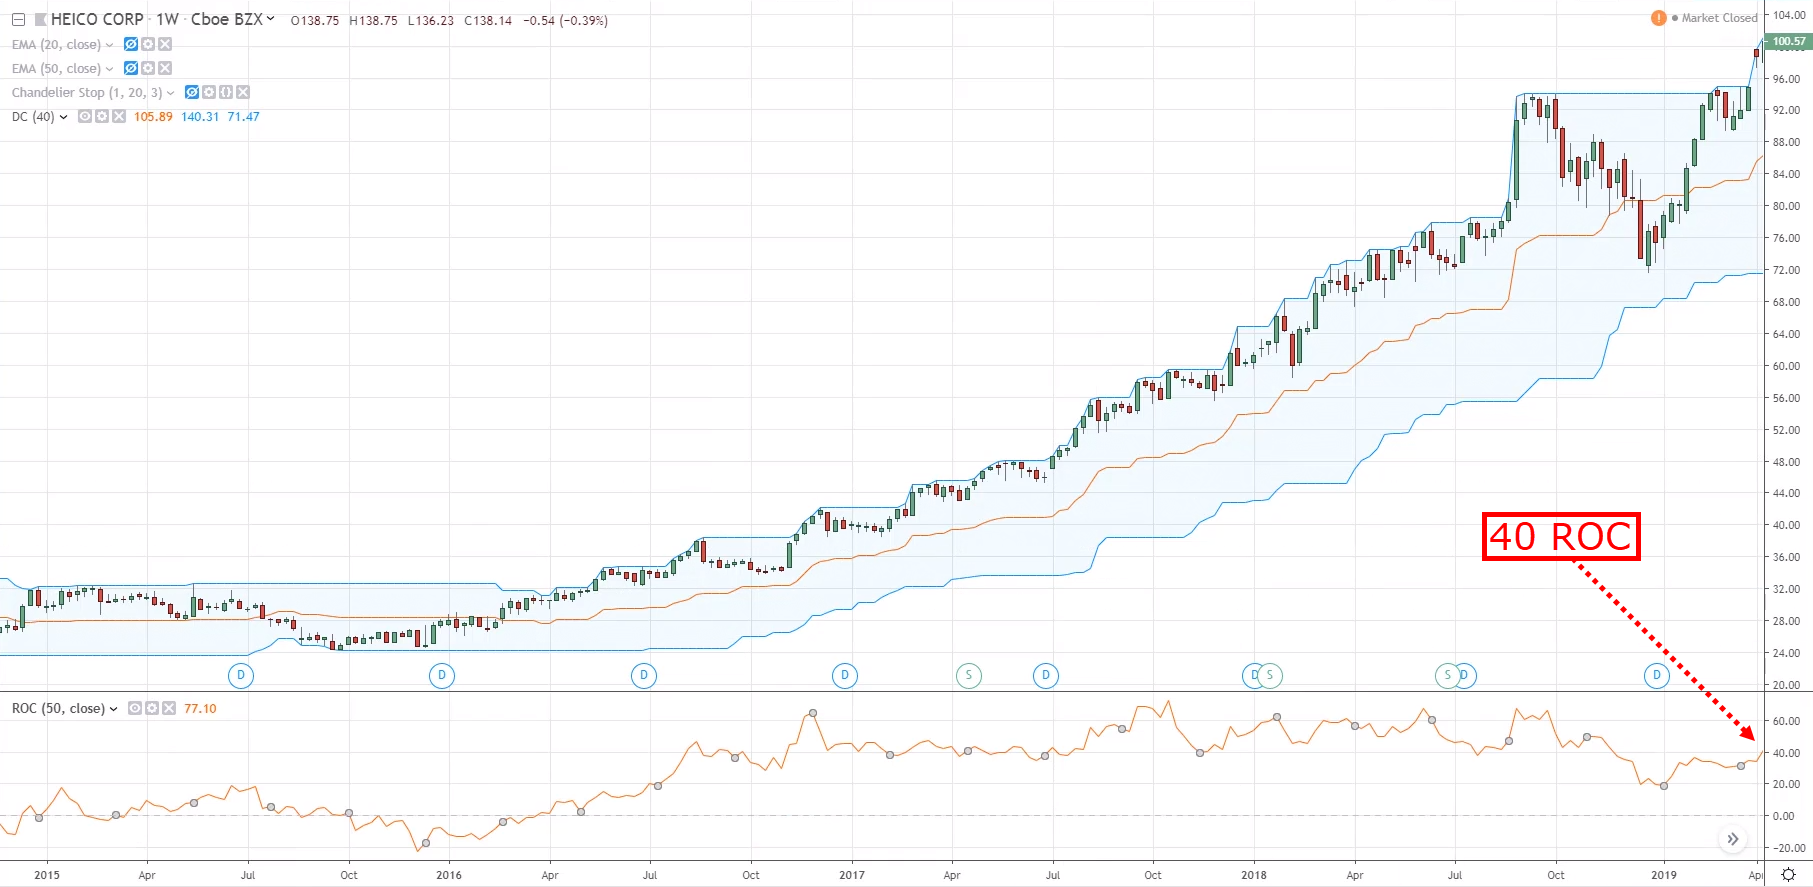
You want to make sure to buy the top 10 stocks.
So you’ll rank the stocks by ROC value from high to low.
Now let's say this stock, the Heico Corp has met the ROC criteria, and is one of the top 10 stocks.
Buying the stock and managing your trade
What you'll do next is you’ll buy the stock at the next candle open.
Let's say the market has already closed on a Friday for this week.
So next week, when the market opens on Monday, you’ll buy at the open:
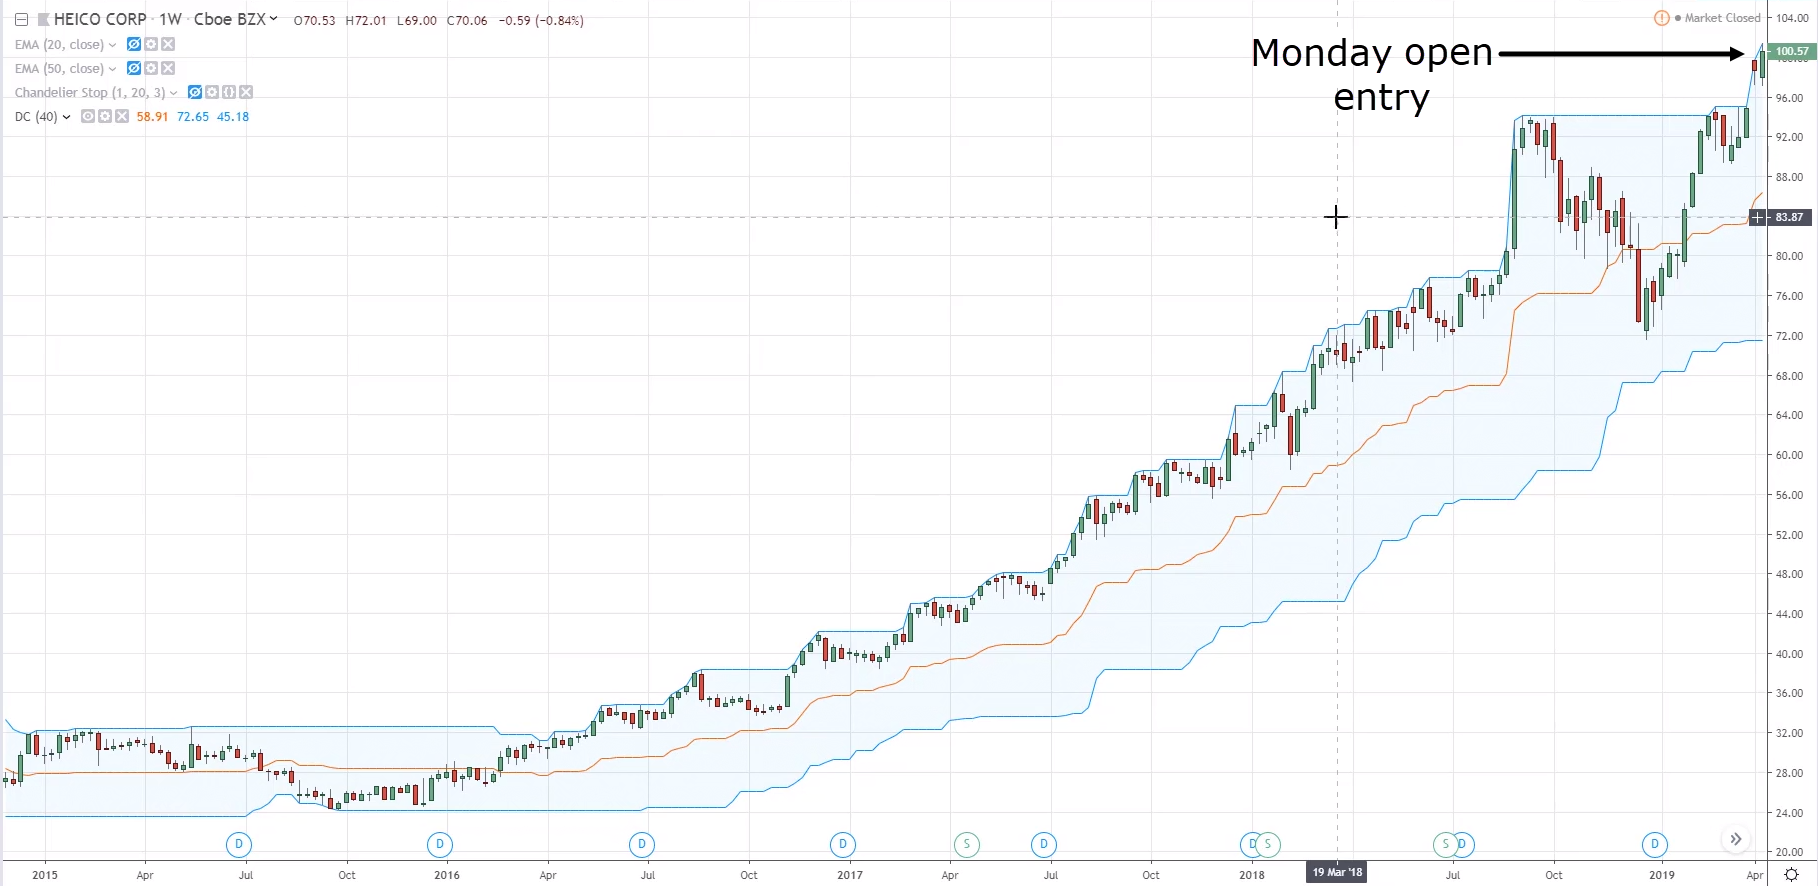
Let's say the price is at $98.
And remember you have a 30% trailing stop loss.
You can simply take $98 multiplied by 0.7, and your trailing stop loss will be at $68.60.
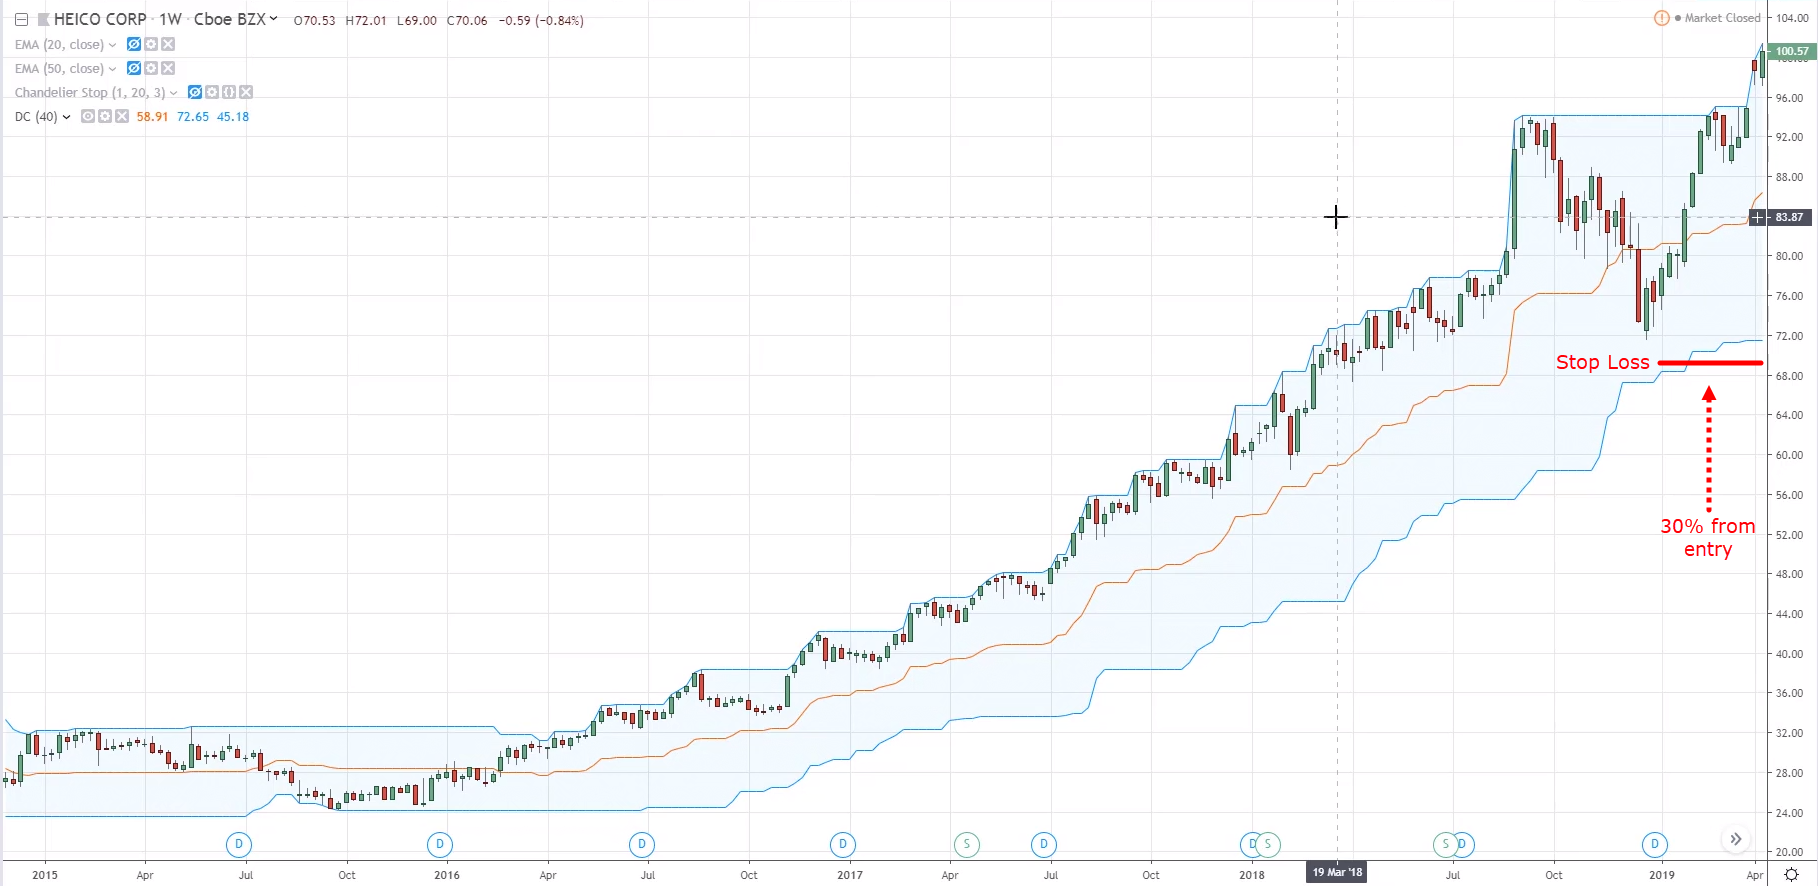
As the price moves in your favour, you’ll calculate the trailing stop loss from the highs.
Let's say at the high, the price is at $104.
Again, you’ll take $104 multiplied by 0.7 and your trailing stop loss will be at $72.80.
Let's say the market was to reverse and close below your trailing stop loss.
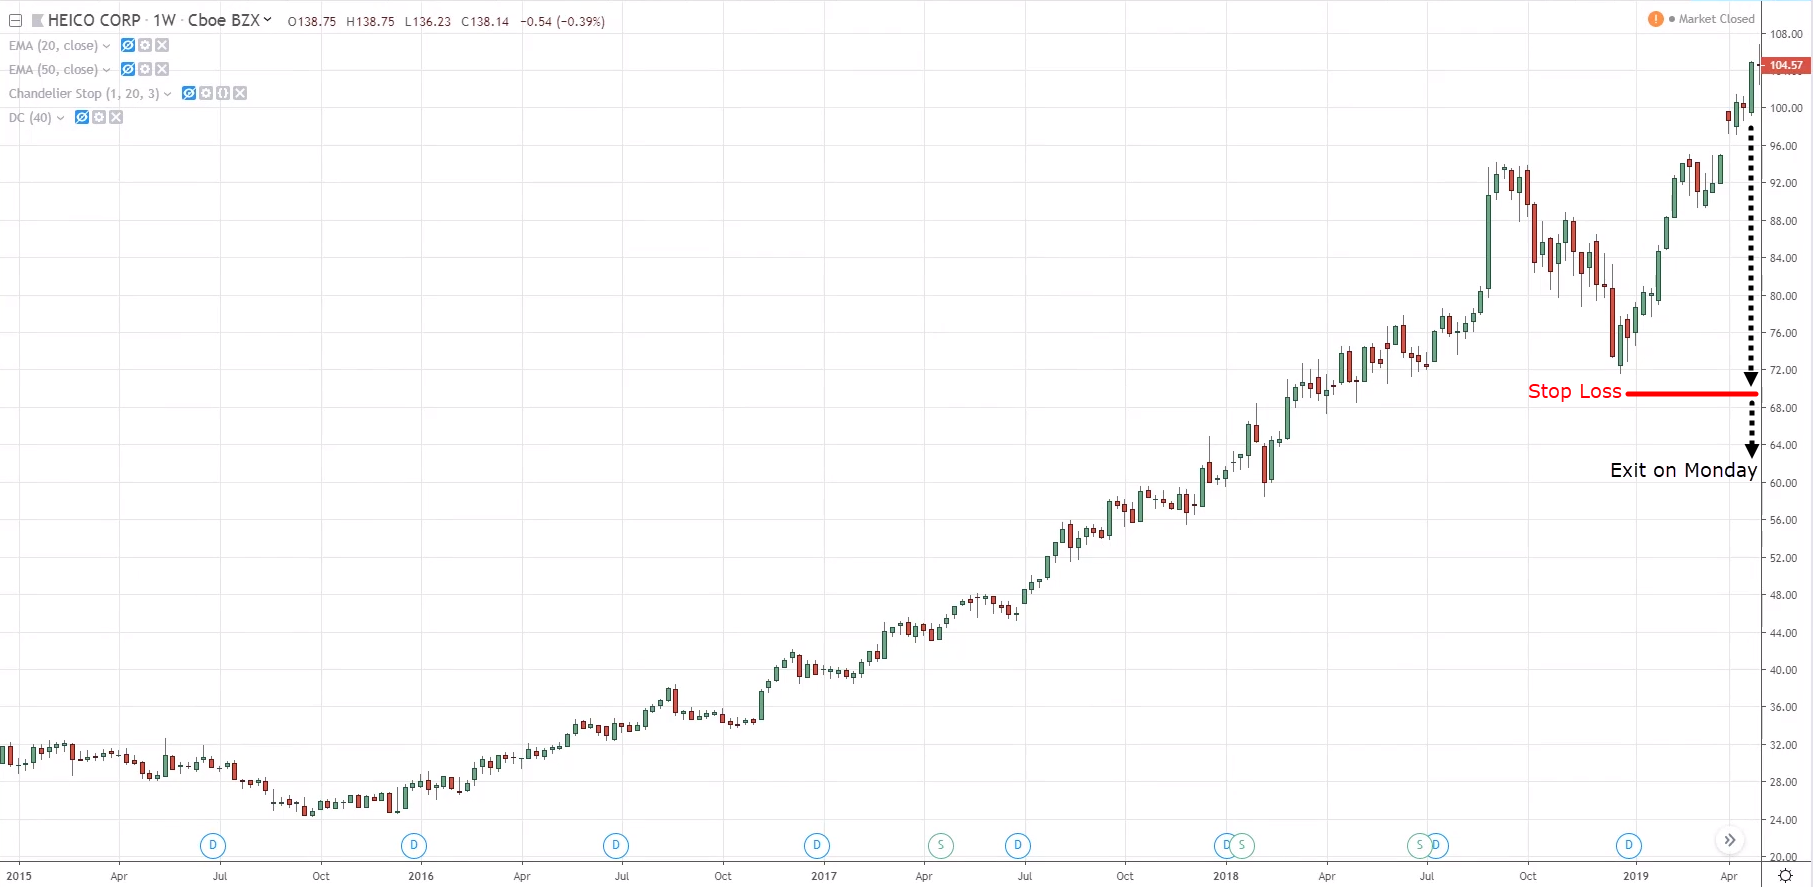
This means that the price has hit your trailing stop loss, and you'll exit the trade on a Monday.
So this is how the trailing stop loss function works.
Also, your exit mechanism is not just based on a trailing stop loss.
It's also based on the Russell 3000 Index:
If it closes below the 100-week MA, you’ll also exit ALL positions regardless of whether it has hit your trailing stop loss or not.
For this example, the price did not hit your trailing stop loss and continues to about $140.
Again, take $140 multiply by 0.7 and your trailing stop loss is now at $98.
Earlier, it was around $68, but it has shifted up higher as the market has gone up higher.
As the price moves higher, your trailing stop loss would progress higher along with it.
This is how your trading setup looks like.
You’re simply buying breakouts of the strongest stocks in the Russell 1000 Index.
You’re buying stocks in the Russell 1000 – because it has the largest 1000 stocks in the US stock market.
These stocks usually have lower volatility compared to the stocks in the Russell 3000.
You’re only referencing the Russell 3000 as a trend filter.
Why use Russell 3000 as a trend filter?
Because this takes into account the large-cap, mid-cap and small-cap stocks.
It's a more accurate barometer of how the stock market is performing.
But the basket of stocks that you’ll trade is only within the Russell 1000 Index.
So with that said, I have come towards the end of this lesson.
I'll see you in the next!
Download: Video | Transcript
Hey hey, what's up my friend!
In this lesson…
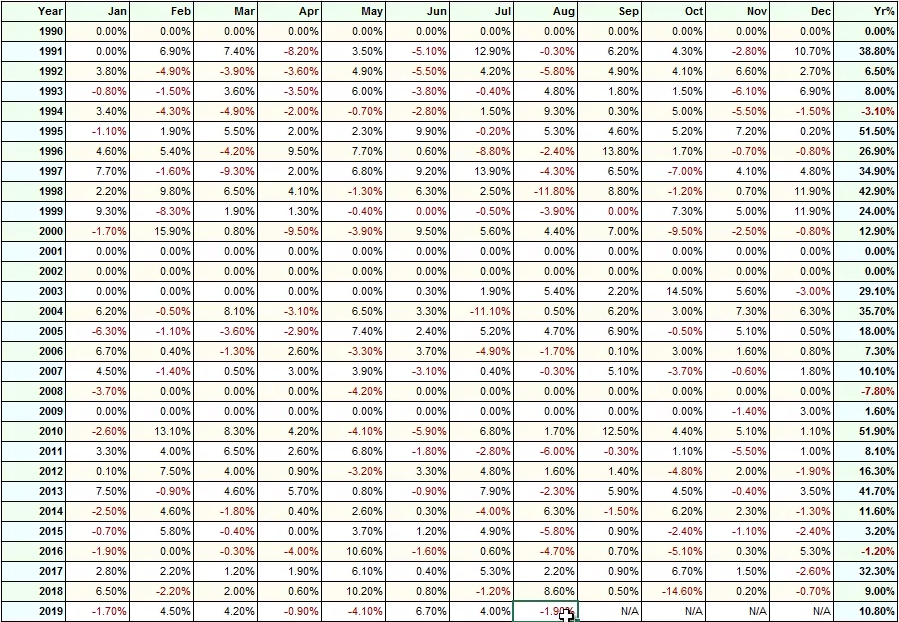
Let me share with you the results of the Power Stock Trading System from 1990 to 2018.
Power Stock Trading System Results (1990 – 2018)
This trading system has been backtested by about 29 years of historical data.
Here’s what it looks like:
- Number of trades: 309
- Winning rate: 54.37%
- Profit factor: 3.62
- Annual return: 17.45
- Max drawdown: 33.73%
PST Results (1990 – 2018): Monthly & Annual Returns
If you look at the year-on-year and month-on-month breakdown:

You can see that this system’s performance at the end of each year is generally positive.
And even if there’s a losing year, it's usually single-digit percentage loss for that particular year.
The worst was in 1994, down 11%.
It’s usually at less than 10% loss for a given year.
So this is the results of the Power Stock Trading System.
This also includes different types of stock market environments.
Like the insane dot-com boom market during 1999, and the year 2000 which it burst.
And this also takes into consideration the ’08, ’09 financial crises.
So you can see that the trading system is robust and it can survive through the different types of stock market conditions.
With that said, I’ll see you in the next lesson.
Download: Video | Transcript
Note: The backtesting of PST is done using data from Norgate.
The scanning of the trading setups is done on Thinkorswim which uses its own data.
So, when it comes to trade execution, there might be a discrepancy between Norgate and Thinkorswim (but they should be similar 90% of the time).
If you want 100% consistency with Norgate, then you need to purchase their data and run it on your own.
You can get the full details here.
How to execute the strategy
Here’s an overview:
- Get a broker that allows you to trade stocks
- Scan the watchlist on weekends (using TOS) for new trade setups and enter the trades on Monday
- Review current positions that hit your trailing stop loss and exit the trades on Monday
Let me explain…
1. Get a broker that allows you to trade stocks
From what I've seen so far, the cheapest broker is Interactive Brokers which offers competitive commissions.
Another one that’s worth looking at is thinkorswim.
Its commission is generally higher, but it allows you to scan the markets quickly, using a few simple rules.
I'll share that with you later.
But this is the best combination:
- Use thinkorswim to scan the markets for your trading setup
- Then execute those trades on Interactive Brokers
But for this particular trading system, the trades are not a lot.
You've seen that there are about 300 trades over the last 29 years.
That's an average of 10 trades per year.
So if you want to do this on the thinkorswim platform, that’s fine as well.
But if you want the cheapest commission, then you might want to consider Interactive Brokers.
2. Scan the watchlist on weekends (using TOS) for new trade setups and enter the trades on Monday
Once you've done this, the next thing you'll do is…
3. Review current positions that hit your trailing stop loss and exit the trades on Monday
So let me walk you through on how to scan the markets for this particular trading system.
How to filter for trend in the Power Stock Trading System
The first thing you’ll need to check is if the Russell 3000 Index is above the 100-week moving average.
So go down to TradingView and enter this symbol RUA.
Select this one over here, the CBOE Russell, 3000 Index.

Then you can insert a simple moving average.

Then you go to the settings and change the length to 100 periods, and you click okay.

And there you have it.
Now…
The key thing to ask yourself is:
“Is the price above the 100-week moving average?”
Remember you’re looking at the weekly chart.
Assuming that now is the weekends, and the market has closed at this juncture:

The price is still above the 100-week moving average.
You have permission to look for a long trading setup.
How to scan for stocks in the Power Stock Trading System
Once you have the permission, you’ll go to the thinkorswim account to scan for your trading setup.
You don't have to scroll through the charts to look for the setup.
Because thinkorswim makes your life very easy.
Let me share with you the settings to use.
All right, let me just remove this. Okay.
First, scan the stocks in the Russell 1000 Index.

So this tells the platform that you only want to look at stocks within the Russell 1,000 Index.
Next thing you want to do is to add study filter.

You’re trading off the weekly timeframe, so you’ll change this to weekly:

Then click this edit button over here:

You don't need the ADX crossover, so just click edit:

And remember you're looking for the price to close above the 40-week high.
Have your settings as such and then click save:

You’ll see this on the Scanner Custom Filter’s Condition Wizard tab.

Let me explain this tab to you.
The thinkorswim platform will scan the current week, for when the closing price is greater than the highest high over the last 40 weeks.
So you’re looking for this week's market to close above the highest high over the last 40 weeks.
Click okay:

Then click scan:

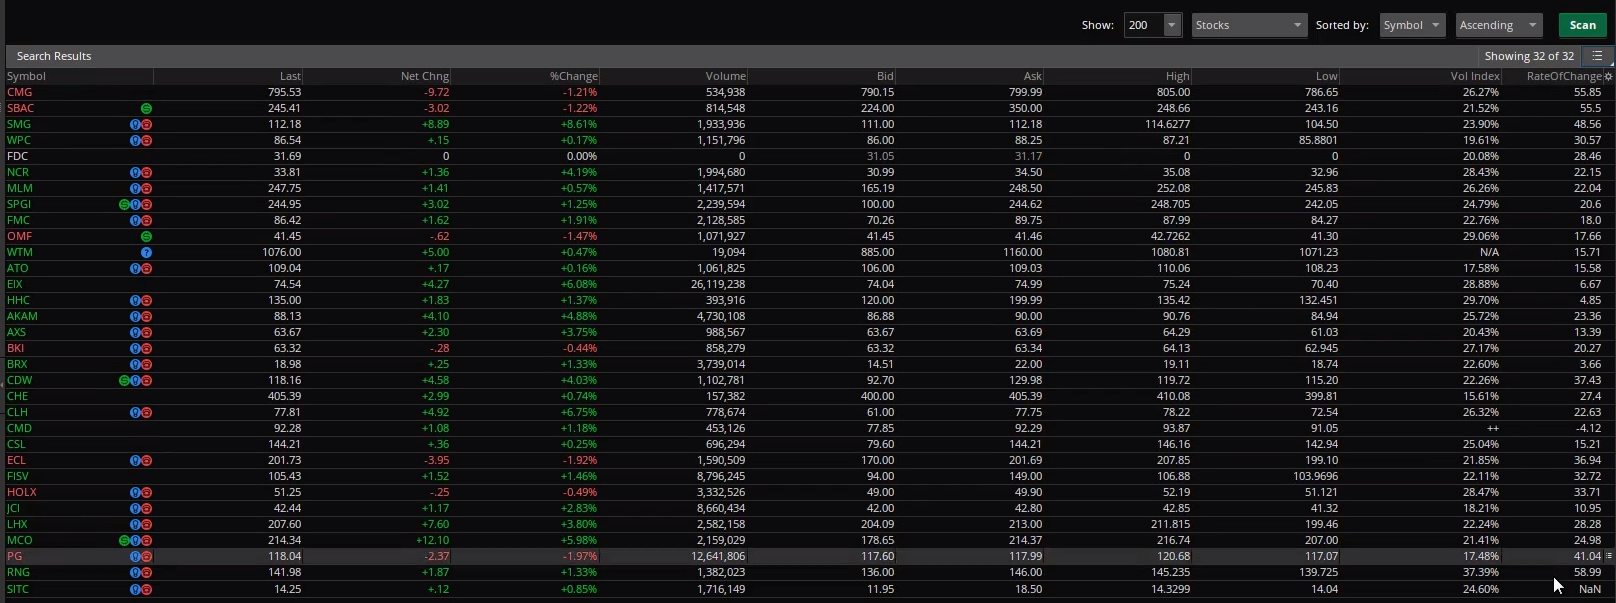
So this platform is going to scan all the stocks within the Russell 1000 Index that meet the criteria.
You can see that these are all the stocks that have popped up.
And when there are too many stocks to choose from, you’ll rank those stocks according to the rate of change over the last 50 weeks.
So go down to settings over here:

Click customize.
Now you’ll look for the rate of change here:

Click on this, then it’s here on the right side.

Its default setting is daily, so you’ll to change this to a weekly ROC.

You’ll use a 50 period ROC (over the last 50 weeks).

And you press okay.
Next, you want to rank this ROC from high to low.
![]()
Now click on it.
Ignore the NAN ones, you want those with numbers beside it.
So let’s take RNG for example.
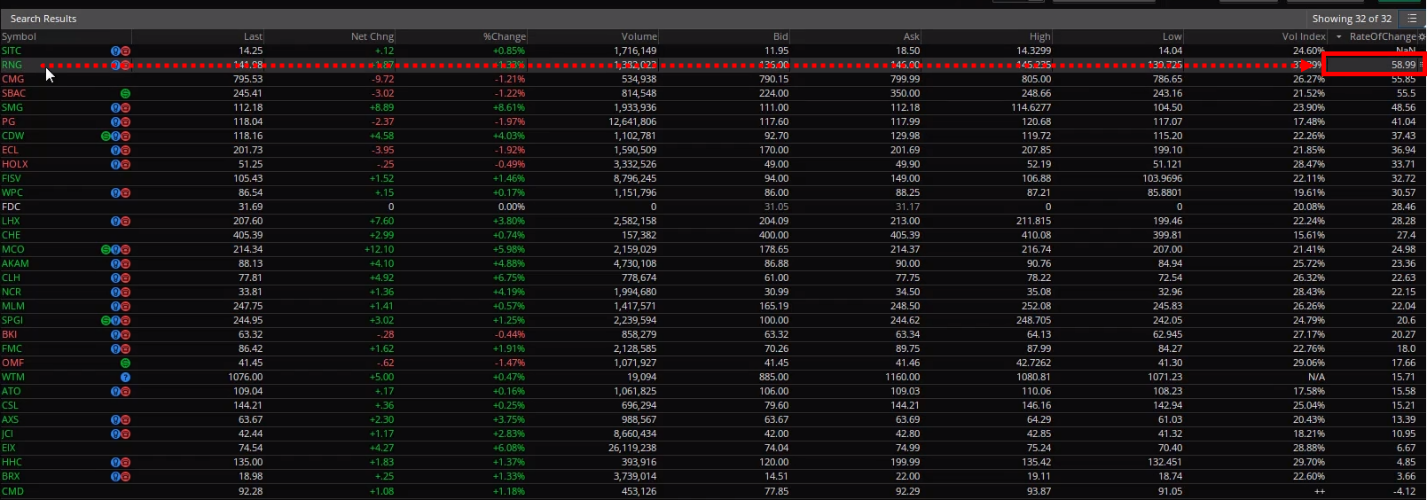
It has closed above the previous 40-week high.
And if you look at the rate of change, it has actually moved 58.99% over the last 50 weeks.
This is pretty much the strongest stock that you have right now.
So you want to be looking at the top 10 stocks ranked according to ROC.
Let's say that today is a Saturday and the market is closed.
Your portfolio has no position now.
So you’ll look to buy these top 10 stocks.
This is how you run the scanner to look for the top 10 stocks in the Power Stock Trading System.
And to make your life easier, you can save your scan query and click save.

In future you can just click load scan query and go to personal:

Then you can find those scan queries that you’ve saved earlier.
With that said, I have come towards the end of this lesson.
In the next lesson…
I’ll talk about how to position size your trades and execute them on the broker platform.
Well that's it, I'll see you in the next lesson.
Download: Video | Transcript
In this lesson…
I'll walk you through how to manage your risk and position size correctly when you trade the Power Stock Trading System.
In the previous lesson, I’ve shared how to scan for the top 10 stocks to buy for the upcoming week.
Now…
How to manage risk and position size correctly
You’ll bring up this Position Size Calculator for Stocks spreadsheet:

This will help you to calculate the optimal position size that you should trade.
Here are what you need to fill in for each column:
- Capital – How much capital you are trading with (eg. $100,000)
- Risk % – Keep it at 0.1 (which is the 10% risk for each stock)
- Stock – Name of the stock (eg. RNG)
- Buy Price – Current price that the stock is trading at on Monday (eg. $200)
- No. of Shares – Spreadsheet will tell you how many shares you can buy
Example #1
If RNG is trading at $200/share, you can buy 50 shares of it.
Next, you’ll go to the thinkorswim platform.
Right-click RNG and select buy:

Change the quantity to 50 in this case:
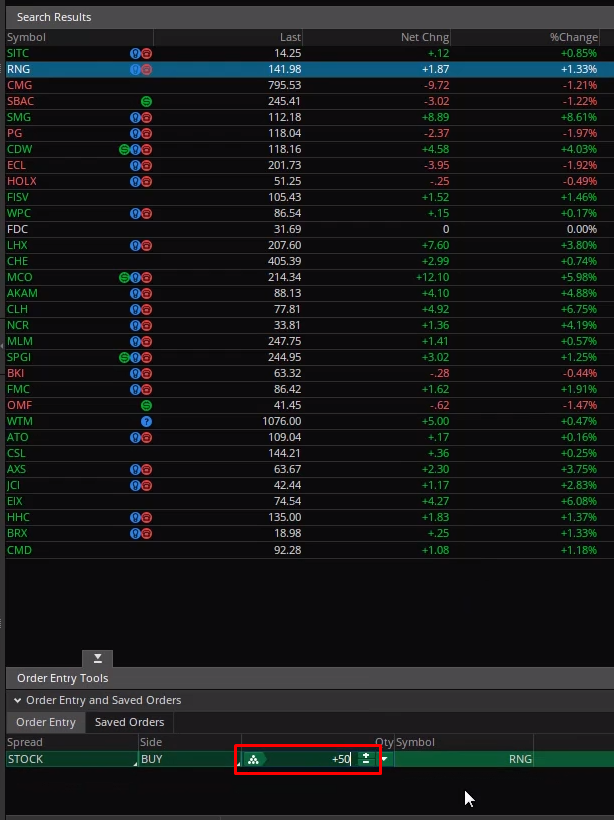
Take note to change the order from a limit order to a market order:
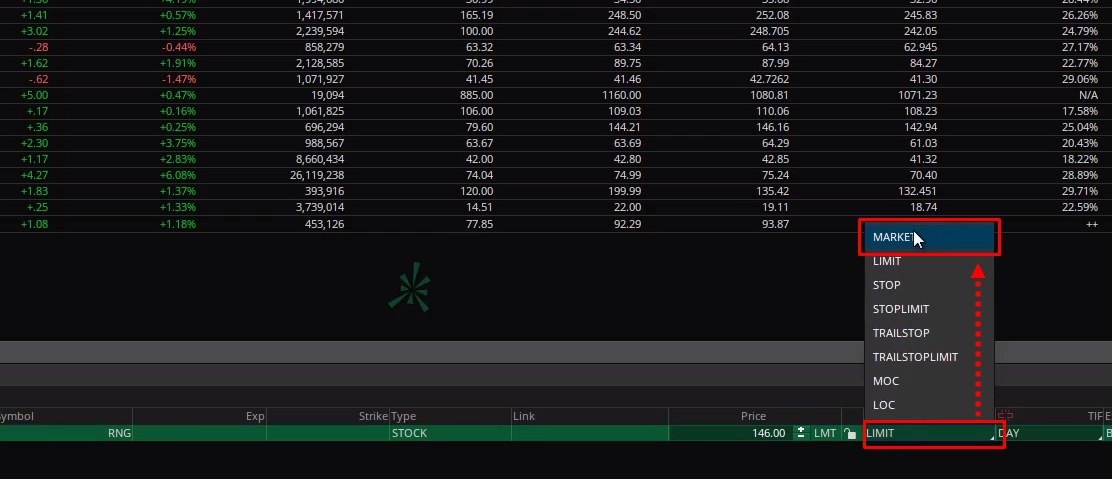
The reason is that sometimes you might not get filled with a limit order.
Once done, click Confirm and Send.

What this does is that it’ll send an order to buy 50 RNG shares at current market price $200.
So this is how you actually position size your trades.
Example #2
Same thing for the second stock, CMG.
It has a high of $805 on that day and a low of $799.
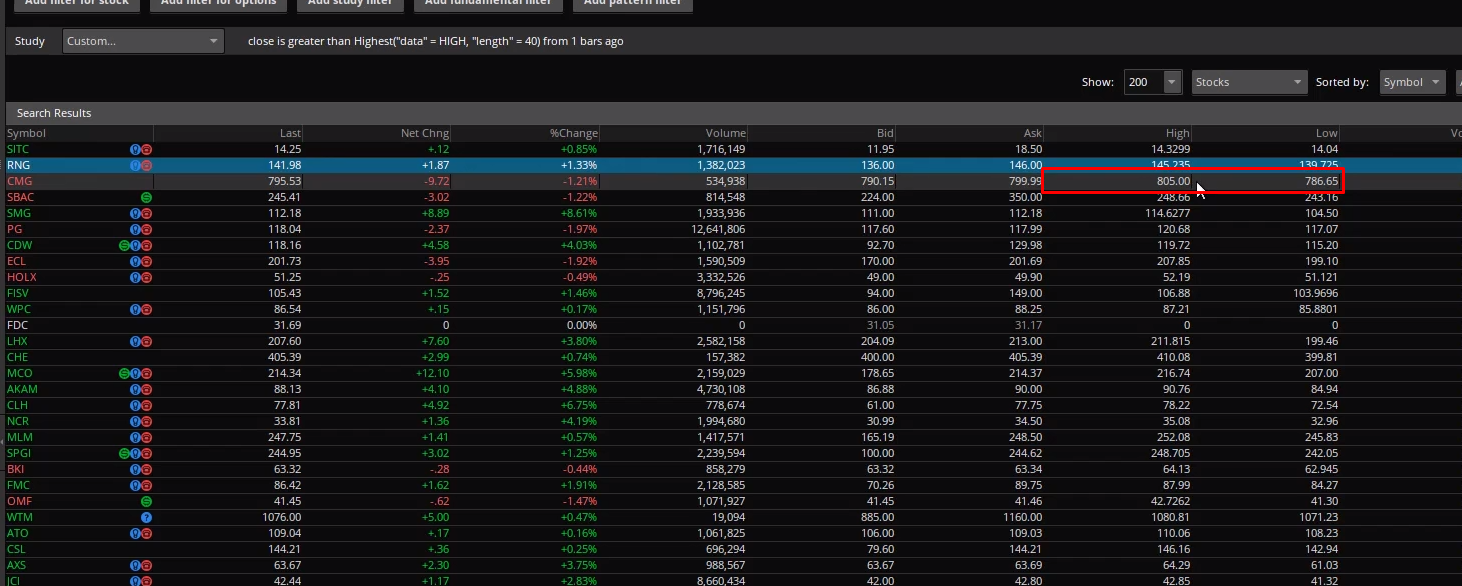
But you won’t know what the stock price is going to be like on Monday.
Let's say on Monday, the price opens up at $800.
The spreadsheet will you that you can buy 12.5 shares.

But the system is not going to let you buy half a share.
So you’ll have to be more conservative and round this down to put 12 shares in the system instead.
You’ll go to CMG and click buy:

Change the quantity to 12:

Then select market order:

Lastly, click Confirm and Send:

It’s going to buy 12 shares of CMG at market price.
So you’ll do this for all the top 10 stocks on the list:

Once you've done it, your capital of $100,000 will be used up to buy all these 10 shares.
And that's how you manage your risk and calculate your position size for the Power Stock Trading System.
If you’re on Interactive Brokers…
Then you’ll go to Interactive Brokers put in the order ticket to buy these 10 different stocks at their respective quantities.
And you’ll just use the market order to buy.
I think that's a should be for you to figure it out on your own.
If not, you can check out the Mean Reversion Trading System, where I Illustrated how to execute trades on the Interactive Brokers platform.
So with that said, I will see you in the next lesson.
Download: Video | Transcript
How to manage your trades
The final part of the equation is managing your trades.
If you recall, the Power Stock Trading System has 2 exit mechanisms:
- The trend filter: if the Russell 3000 breaks and closed below the 100-week moving average, you’ll exit all positions.
- If the Russell 3000 Index doesn't close below the 100-week moving average, then you’ll apply the trailing stop loss.
Let me explain…
1. The trend filter: if the Russell 3000 breaks and closed below the 100-week moving average, you’ll exit all positions.
Bear in mind, you’re looking at the weekly timeframe.
So the price on the weekly chart on Friday has to break and close below the 100-week moving average.
If the price closes below the 100-week moving average within the week itself (the weekly candle has not closed)…
Then you’ll not exit that trade yet.
You’ll only exit if the weekly candle closes below the 100-week moving average.
So that's the first exit mechanism that you have.
2. If the Russell 3000 Index doesn't close below the 100-week moving average, then you’ll apply the trailing stop loss.
A trailing stop loss technique is very simple.
As the price moves up higher to form new highs, your trailing stop loss is simply 30% below the highs.
The math is simple.
Let’s say the high is $X.
Take $X multiplied by 0.7 – and that is your trailing stop loss (TSL).
(I've also done the formula for you in the Position Size Calculator for Stocks spreadsheet.)
Example #1
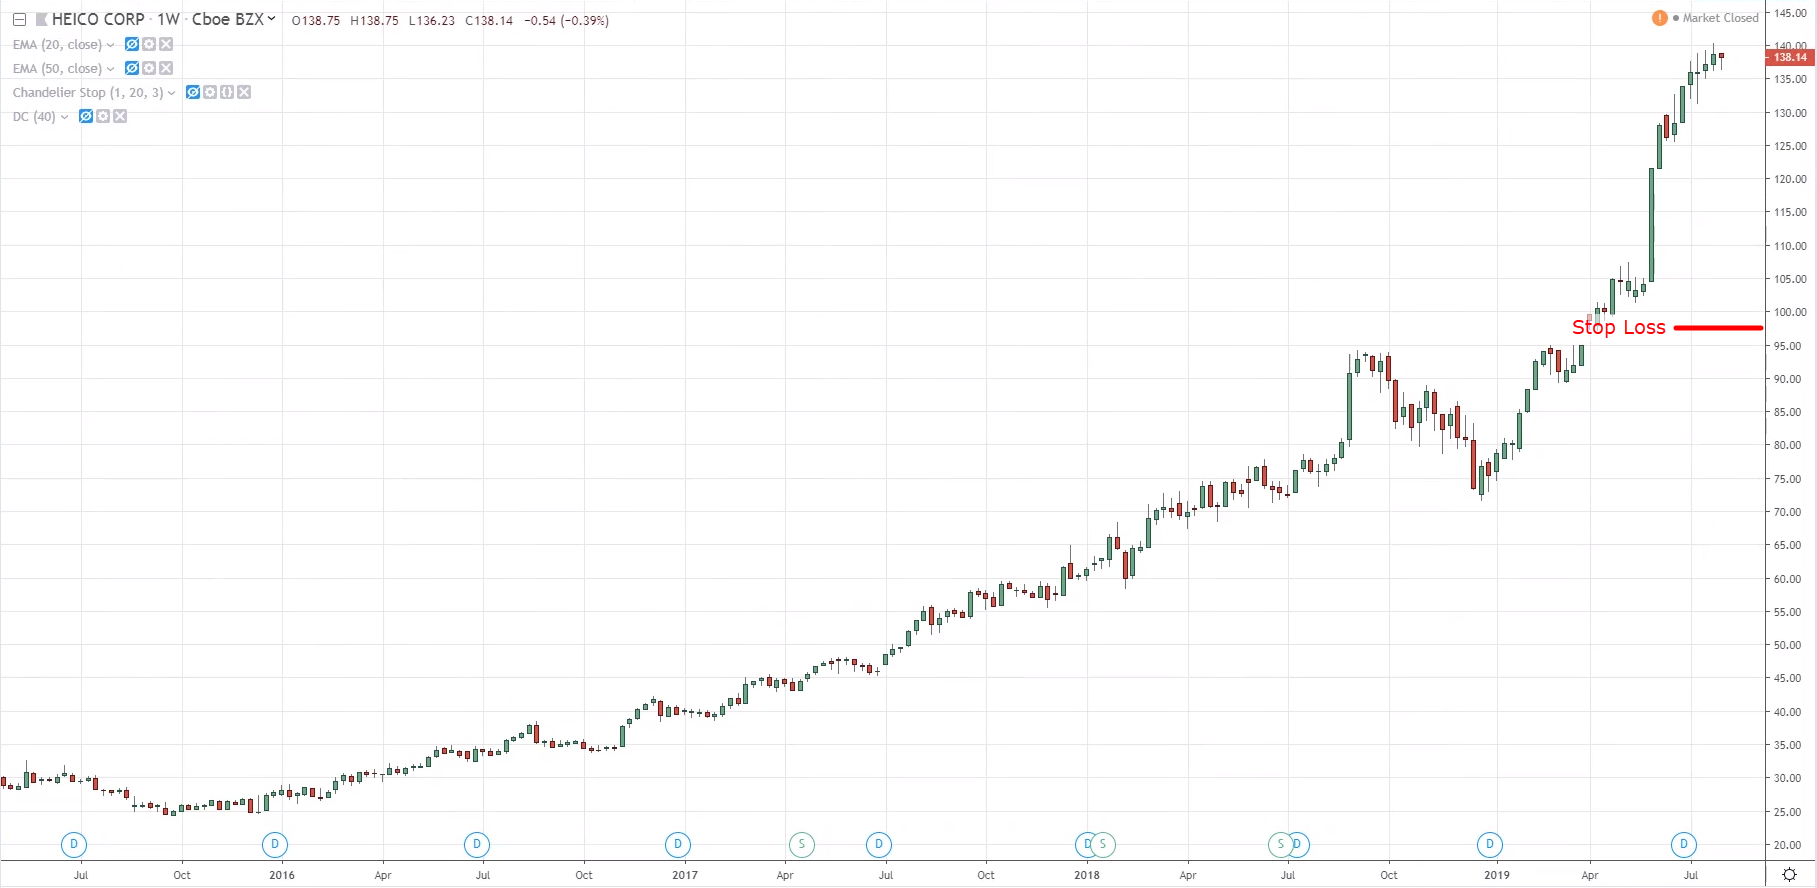
Let's assume you bought RNG and it ran up to a high of $300.
This means that your trailing stop loss will be $300 multiplied by 0.7, which is $210.
This is a weekly trading system, so if the weekly candle broke and closed below $210, you’ll exit the trade.
If not, you’ll hold onto the trade (assuming the Russell 3000 Index is still above the 100-week moving average).
Example 2
Let's say you’ve bought CMG and it went up to a high of $1000.
Your trailing stop loss is now at $700.
So if CMG’s weekly chart breaks and closes below $700, you’ll exit the trade.
This is how the trailing stop loss works.
What you’ll do every Saturday or Sunday (after the market closes on Friday) is:
1. Check how's the Russell 3000 doing
If it’s still in an uptrend, then it means that you have permission to buy the stocks.
So you’ll run through the scan and buy all those stocks.
If you’re already maxed out with 10 positions, then you don't need to buy any more stocks.
2. Check whether the existing stocks that you're holding have hit your trailing stop loss
You’ll find out what is the highest price for the stocks after you’ve bought them.
Write down all the highest price over here (in the spreadsheet):

And then look and the trailing stop loss values.
Then you’ll reference these trailing stop loss values and see if the stocks have broken and closed below those values.
And that's how you manage your trades for the Power Stock Trading System.
Let’s say there are 5 stocks that hit your trailing stop loss.
This means that now you’ll have 5 stocks to buy.
Now you’ll scan the markets again and buy 5 new stocks to replace the 5 stocks that had their trailing stop loss hit.
You’ll end up with 10 stocks in your portfolio.
Of course, there are times when you scan the markets, but you don't get any signals.
Then so be it, you’ll just hold onto these 5 stocks.
So with that said…
I’ve come towards the end of this lesson and I'll see you in the next.
Download: Video | Transcript
Power Stock Trading System: How to scan for setups
You can see on the top of the Scan tab, there are these rules of the scan:

Once you click the green Scan button on the right, you’ll get a bunch of results in the middle where you will then rank them according to the Rate of Change.
An important note is this – you want to click on Show and select “1000”, then click the green Scan button.

The reason for this is that you’ll get a more accurate result.
Because if you only select “Show 20”, it will only you those few 20 results according to the rules of the Power Stock Trading System.
This means that it will ignore the other potential trading setup since you had only requested to show 20 results.
Now, you want all the stocks in the Russell 1000 to be shown and then rank according to Rate of Change, that’s why you’ll want to select “Show 1000”.
This is important, don’t forget about this.
Download: Video | Transcript
Bonus: PST (Gap)
Hey hey, what's up my friend!
So in this lesson, I’ll share a little tweak that you can make to your Power Stock Trading System to improve its results.
The tweak that you’re going to make is a gap filter.
Because you want to avoid buying stocks that have gapped more than 5% over the last 60 days.
The reason for it is this:
Stocks that have gapped a lot recently tend not to perform so well in the near future.
You’ll rather trade breakouts on stocks which are steady and consistent rather than those that have a sudden huge spike or gap up higher.
PST (Gap) Rules
These will be the rules that add on to the Power Stock Trading System:
- Enter/exit trades every Monday
- Russell 3000 must be above the 100-week moving average (or else remain in cash)
- Buy stocks that break and close above the 40-week high (in Russell 1000)
- Pick the top 10 stocks that have the highest ROC values over the last 50 weeks (and did not gap more than 5% over the last 60 days)
- Trailing stop loss of 30% from the highs
- Exit all positions if the Russell 3000 closes below the 100-week moving average
Let me walk you through this again.
1. Enter/exit trades every Monday
For the Power Stock Trading System, you’ll trade every Monday.
2. Russell 3000 must be above the 100-week moving average (or else remain in cash)
This acts as the trend filter for you to determine whether you should be long or in cash.
If the Russell 3000 index is above the 100-week moving average, then it's a green light to buy stocks.
3. Buy stocks that break and close above the 40-week high (in Russell 1000)
So you'll buy stocks that have broken and closed above the 40 week high.
Now you’re actually, looking at stocks in the Russell 1000 index, not the Russell 3000.
The Russell 3000 is only a trend filter to let you know if you should be buying or holding onto cash.
The stocks that you’re trading, are stocks within the Russell 1000.
Next…
4. Pick the top 10 stocks that have the highest ROC values over the last 50 weeks (and did not gap more than 5% over the last 60 days)
So you’ll buy the stocks that have moved the most over the last 50 weeks.
Because these are the ones with momentum, and you’ll expect this momentum or uptrend to continue.
And this is the new filter you have:
Did not get more than 5% over the last 60 days.
5. Trailing stop loss of 30% from the highs
Trailing stop loss is the same – 30% from the highs.
6. Exit all positions if the Russell 3000 closes below the 100-week moving average
And you’ll exit all positions if the Russell 3000 (trend filter) closes below the 100-week moving average.
Because this means that it’s a bear market and you will hold onto cash.
So these are the rules of the Power Stock Trading System with gap filter.
PST (Gap) Results (1990 – 2019)
Annual return: 16.38% (compared with 17.3% in original rule)
Max drawdown: 22.48% (compared with 33.73% in original rule)
PST (Gap) Results (1990 – 2019): Monthly & Annual Returns
Here are the results over the last 30 years:
If we compare them side by side:

You can see that in recent 4 years, the one with the gap filter is performing better.
So this tweak is something you can consider if you want to improve your returns relative to risk.
Because according to the backtest, the one with the gap filter comes with a slightly lower return but a much lower drawdown.
How to scan for stocks using this filter
So now the question is…
“Okay Rayner, how do I apply this and scan for this particular system with the gap filter?”
It’s quite simple.
Go to your Thinkorswim account.
Click ‘Add study filter’.

Since you’re looking at the daily timeframe, this will be ‘D’:

Now click the edit icon beside it and click thinkScript Editor:

And you’ll copy and paste this code in:
#........................................NO GAPS SCANNER...........................................................................................
def pct=1.05;
DEF gap=open>close[1]*pct;
def con=highest(gap[1],60)<1;
plot scan=con;
What this means is to avoid showing stocks that have gapped more than 5% over the last 60 days.
Then you’ll click OK.
Once that’s done, there you have it.
Now when you click scan, the results will exclude stocks that have gapped more than 5% over the last 60 days.
Sounds good?
With that said…
I have come towards the end of this lesson, I will talk to you soon.
Can I use a market cap filter to trade stocks that have greater than 2B market cap regardless if they are in the Russel 1000 or not?
Yes, you can do that but the back test results will be different.
I’ve back tested it on S&P 500, Russell 1000, and a few other indices and it all shows a positive expectancy.
Are there any liquidity filters such as minimum stock price or volume?
There isn’t.
But if you’re worried about liquidity issue, you can choose stocks above $2 and with at least 500,000 shares traded daily.
Does the PST work for short selling if the criteria are met with the opposing rules like Russell 3000 below the 40 weeks MA and stock price break and close below the 40 weeks low?
No, don’t do that.
It’s a losing strategy because Stocks trend higher in the long-run.
Can the PST be applied to Singapore stocks?
I won’t suggest it as the market is smaller and the results might be different from trading the US stock markets.
What if the stock price goes below the 30% trailing stop loss from the highs (from Tuesday to Friday), do I exit the trade immediately without waiting for the weekly candle close?
No.
You wait for the weekly candle to close first and then decide whether to exit, or not.
For the trend filter, is it simple or an exponential moving average?
The back test results use a simple moving average.
However, on the TradingView chart example, I used the exponential moving average (my bad).
But, it doesn’t matter whether it’s exponential or simple moving average because the concept is what matters.
Have you tried buying only the top 10 ROC stocks every week?
Yes, that could work and you will get a trading system similar to MOMO stock trading (albeit on a different timeframe).
Why do you use Russell 3000 as the trend filter instead of S&P 500/ NASDAQ etc?
I chose the Russell3000 because it consists of large-cap and small-cap stocks, which gives a good representation of “the market”.
Now, there’s nothing magical about the trend filter. You can use the S&P 500, Russell 1000, or an index that the stocks belong to—and it will work fine.
The Power Stock Trading System is developed using the ideas and concepts from:
The Weekend Trend Trader by Nick Radge
Unholy Grails by Nick Radge
Stocks on The Move by Andreas Clenow
Quantitative Momentum by Wesley Gray and Jack Vogel
If you want to learn more, then check out the resources above.