Download: Video | Transcript
Hey, hey, what’s up, My friend!
It’s Jet here, one of the coaches of the UST program.
As you know, in the Systematic Trend Following system, we specifically teach you how to implement it on your own.
Which is to manually check the charts and see if there are 200-day breakouts for you to go long or short, to show your stop loss.
However, we also have a complimentary service for you, which is the Portfolio Tracker which you have access for 12 months or 24 months depending on your package:
![]()
What happens if you have discrepancies between your portfolio tracker and the CMC market?
What would now happen if both of them have discrepancies?
Example:
On your chart, it says that you should “Exit” soybean:
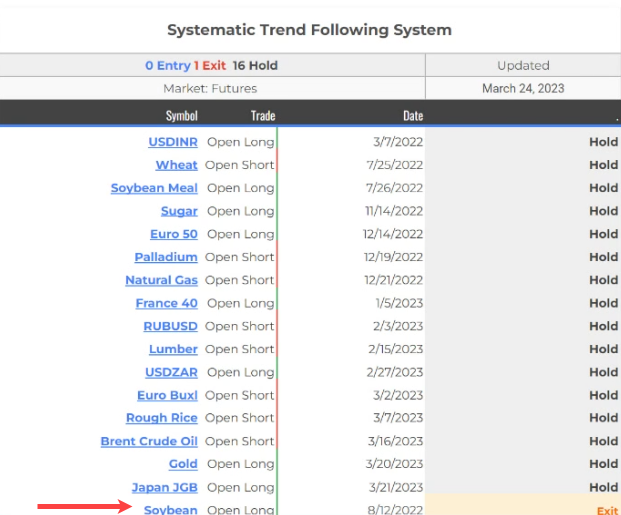
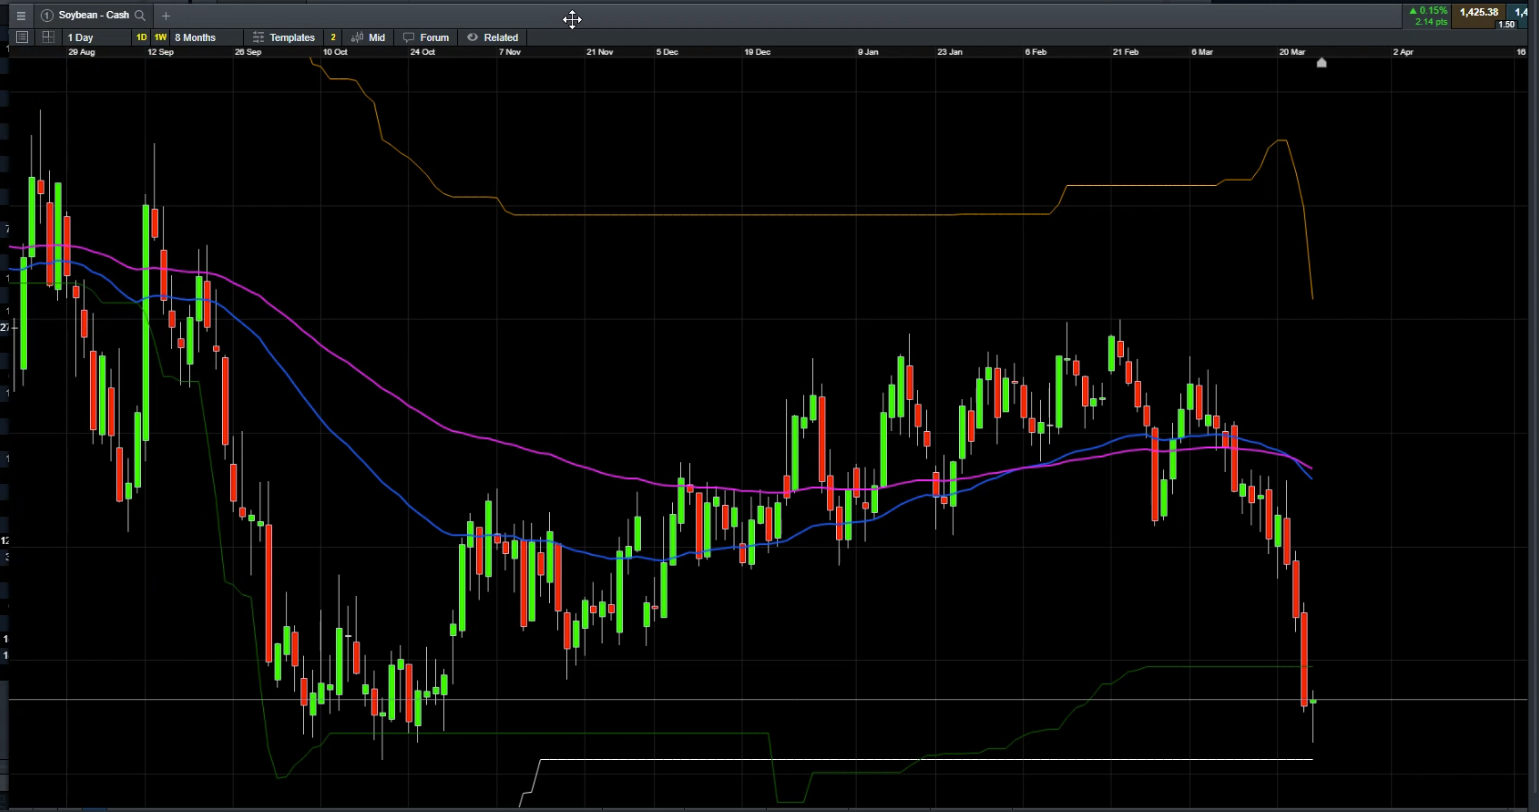
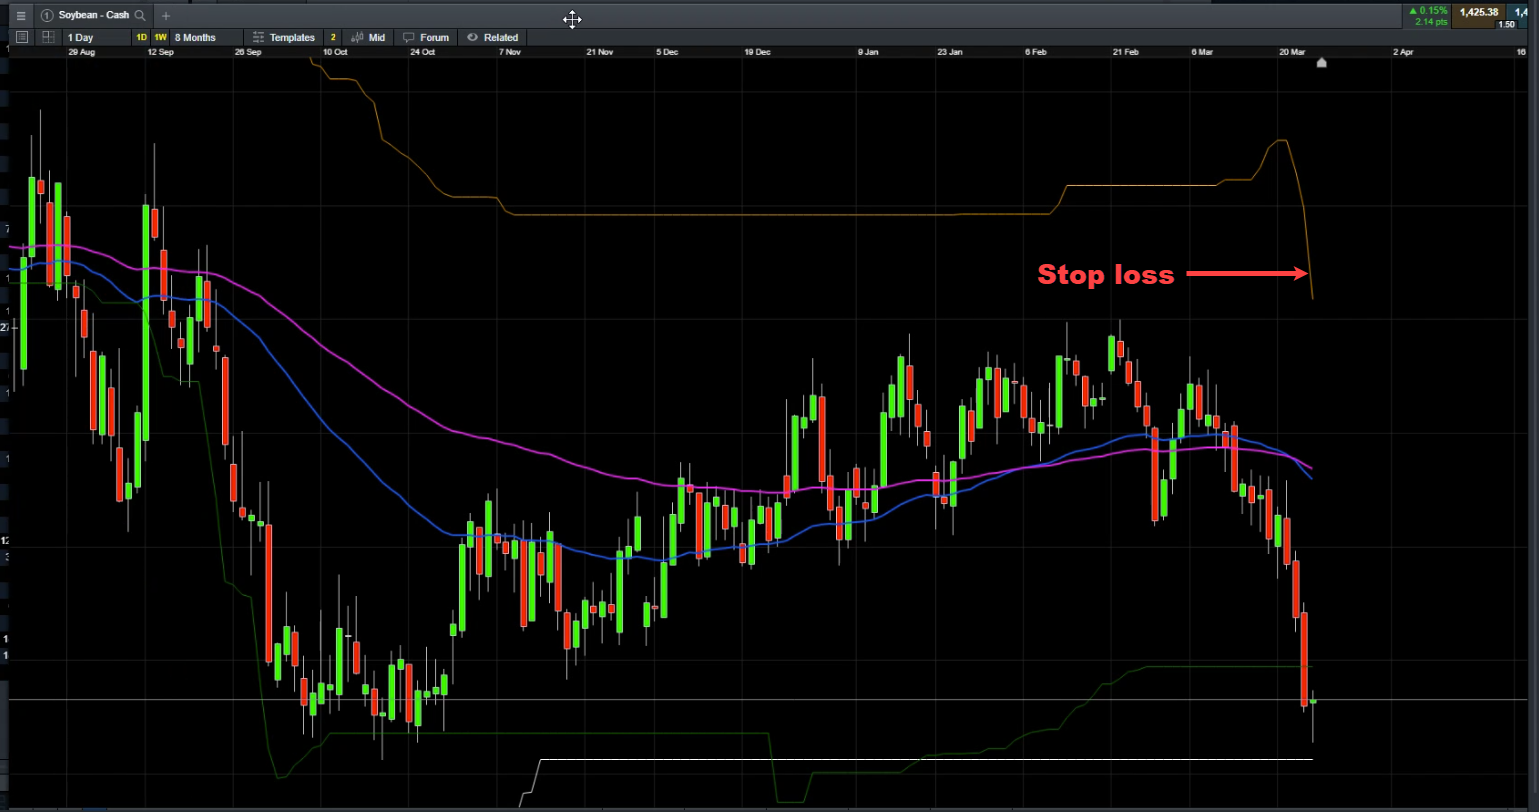
However, looking at your soybean chart, it is not yet an “Exit”:
Which data should you follow?
The answer to that discrepancy is a matter of decision.
If you want to be consistent using the portfolio tracker, then what you just do is you would completely depend on the portfolio tracker for your entry, hold, and exit.
You have to apply your position sizing.
If you decide to depend on the portfolio tracker, which doesn’t last forever, then what you can do is just, for example, it says “Exit”
![]()
Then you would just use CMC markets or the broker to execute your trades.
Example:
If there’s a “Japan JGB” entry

Then you would use that entry as a signal.
Then of course, you will still look at your charts on CMC markets and identify where your stop loss price is and where is 1% risk-reward/trade and so on.
Even if for example, Soybean says “Exit”:
![]()
But on your CMC markets data, it still shows that you should still be at the trade
Of course, you will still follow the Portfolio Tracker. Only “Exit” the trade unless the portfolio tracker says “Exit”
On the other hand, if you plan to completely depend on the CMC market, you plan to do your charts, which is fine because it is what we teach you in this module on how to implement it on your own, to become independent.
Then what you can do is use the portfolio tracker as a compliment.
Example:
If the portfolio tracker says “Exit”
Then, of course, it’s like a reminder platform for you in case you might have missed trades:
![]()
Then it’s a signal for you to check on your charts on your CMC markets, whether or not you should really “Exit” soybean.
And if soybean says that on the data of CMC markets, you should still hold onto the trade, then you should not exit the trade.
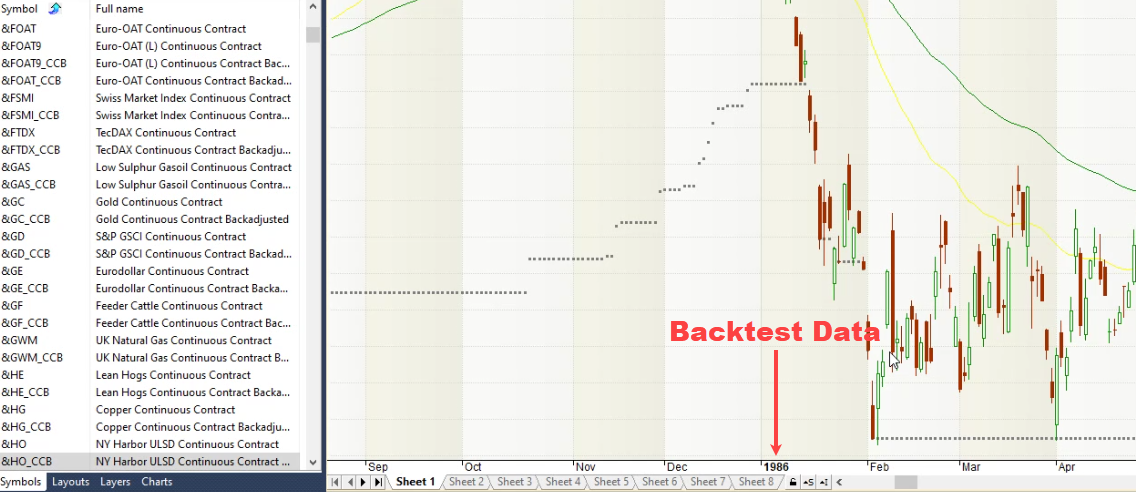
The reason why we offer these alternatives, whether you depend on the tracker or you depend on the CMC markets data is that on the portfolio tracker, we use Norgate data and these data can go back from 1986, and so on:
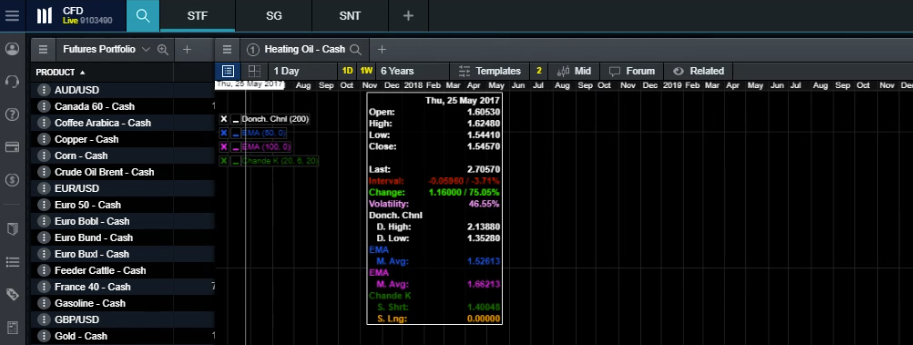
Whereas, in the broker data, let’s say of heating oil:
It can only go back up to up to 2017.
Since we use this to make sure to back-test our systems, this is where the discrepancy in the data comes from.
In Amibroker, we use Norgate data and futures data. Wherein in CMC markets, we use a CFD broker or the broker’s data.
But basically, this is why we give you an option that you should either completely depend on the tracker, then execute your trades on the CMC markets.
OR
Completely depend on CMC markets and only use the tracker as a compliment to remind you to see which market you may or may not have missed.
I hope it’s pretty much clear between the Portfolio Tracker and the actual execution of the broker itself.
If you have any questions, you are free to email me anytime at:
I will talk to you soon.

